During the pandemic, a historic number of Americans ventured into entrepreneurship, leading to a significant surge in new business applications. However, the reality of running a business is challenging, as reflected in recent data.
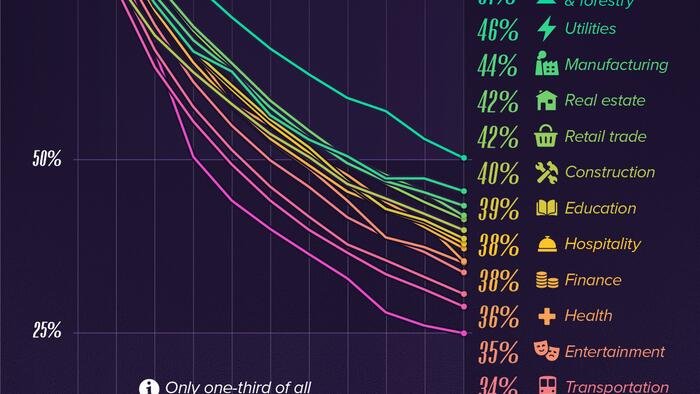
Visual Capitalist’s Pallavi Rao presents a chart tracking the survival rates of private American companies established in 2013, categorized by industry. The data, sourced from the Bureau of Labor Statistics, paints an insightful picture of the business landscape in the U.S.
Survival rates for new businesses vary depending on the industry they operate in. For instance, Agriculture and Forestry businesses established in 2013 displayed remarkable resilience over the past decade, with over half still operational in 2023. On the other hand, only a quarter of Mining, Oil & Gas firms survived during the same period.
Interestingly, both agriculture and energy sectors are major recipients of government subsidies, with federal agricultural support estimated at $30 billion annually and the energy sector receiving around $20 billion, predominantly directed towards oil and gas.
Differences in ownership structure and business size may contribute to the varying survival rates. For example, a large percentage of U.S. farms are family-owned and categorized as small farms, potentially requiring less capital investment compared to oil and gas businesses.
One common trend across industries is the challenging first year for businesses established in 2013, with a significant decline in survivors. As time progresses, the rate of decline slows down.
Ultimately, the data reveals that only about one-third of private businesses incorporated in 2013 were still operational by 2023. The public perception of farming and agriculture industries in the U.S. remains positive, as indicated by public opinion ratings.
For more insights into America’s views on U.S. industries, explore Chartr’s analysis on Voronoiapp.com.

