

The world of cryptocurrency is currently experiencing a turbulent period with widespread declines, but amidst this chaos, the XRP price is drawing the attention of analysts who remain optimistic about its future. One expert has identified a rare and bullish setup for XRP, with various chart indicators signaling potential upward momentum.
XRP Price Shows Signs of Bullish Setup
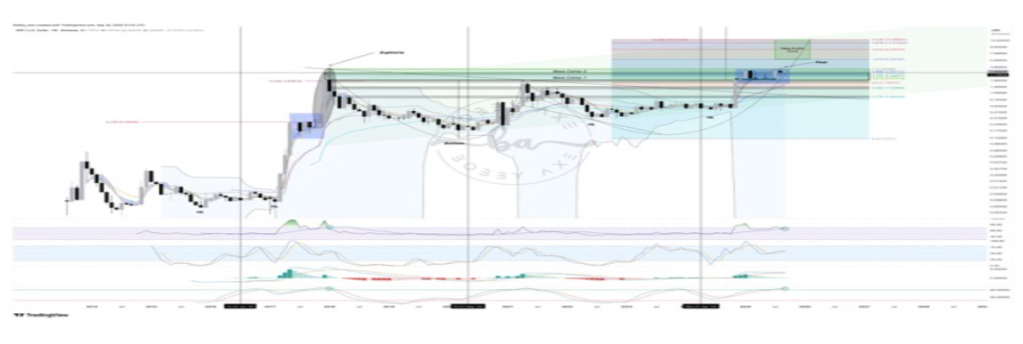
Renowned crypto market analyst Bobby A has pointed out that XRP is in a unique market position, consolidating above key historical levels and gearing up for a possible surge that could lead to new all-time highs. He highlighted the alignment of different indicators supporting a potential uptrend.
Related Reading
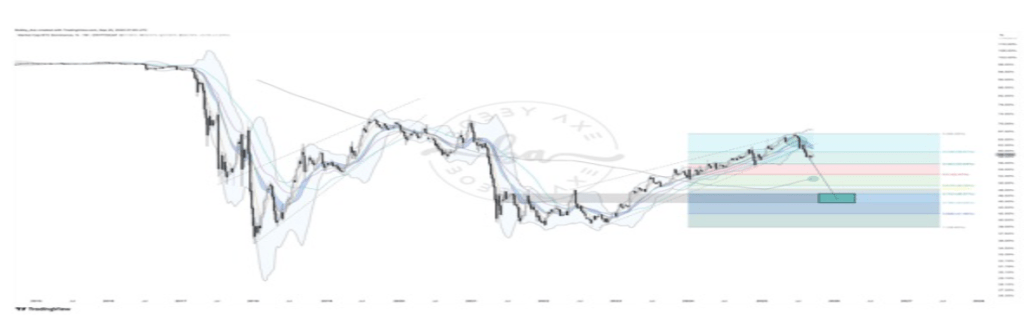
Bobby also shared a chart on social media, showing that XRP’s market capitalization has remained above its 2018 peak for over 300 days, indicating significant strength during the recent downturn. This extended consolidation above a major resistance-turned-support level suggests a significant buildup of energy before the next upward move. Bobby predicts potential market cap targets at $173 billion and a peak around $727 billion.

In terms of price action, Bobby noted that XRP has been forming a multi-month bullish flag pattern on its charts, with critical support zones at $1.9 and $2.89 holding strong. He also pointed out that the monthly Relative Strength Index (RSI) is positioning itself for a potential move towards overbought territory, typically preceding a sharp upward trend. Bobby’s projections indicate take profit zones for XRP between $5 and $13, representing new all-time highs.
Bobby’s analysis emphasizes that XRP’s indicators are showing strong momentum across higher timeframes, aligning for a potentially significant surge. He also highlighted the expected retracement of Bitcoin Dominance (BTC.D) from 58.7% to the mid-to-low 40% range, paving the way for altcoins like XRP to gain a larger market share and potentially experience a bullish breakout. This rare alignment of factors is described as a generational setup that occurs infrequently.
Bearish Divergence Leads to Short-Term XRP Sell-Off
Despite XRP’s resilience in the current market turmoil, not all analysts share a bullish outlook in the short term. Crypto expert JD has highlighted a Bearish Divergence on XRP’s weekly chart, a signal that has resulted in a recent sell-off as predicted.
The chart clearly shows that while XRP’s price reached higher highs, the RSI indicator formed lower highs, indicating a Bearish Divergence pattern. This divergence has led to a significant 27% correction from the previously identified take profit level of $3.37. JD points out that many market participants are questioning the downward pressure on XRP despite overall optimism in the market.
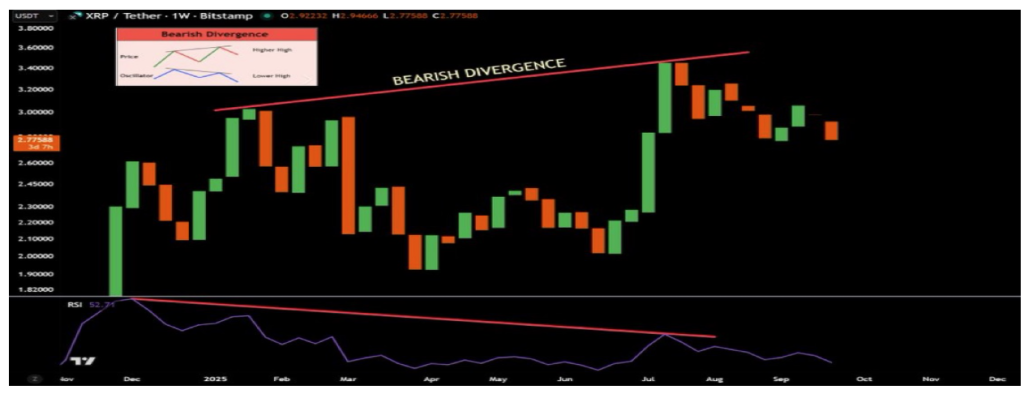
JD warns that the Bearish Divergence was a clear signal that should not have been ignored, and those who did are now experiencing its consequences. He suggests that while XRP may avoid a deeper decline into the “grey box” supply zone, the short-term outlook remains bearish until momentum resets.
Featured image from Unsplash, chart from TradingView