

NEAR Protocol [NEAR] saw a significant price surge, reaching a high of $6.00 on October 12th. This marked the highest price level for the altcoin since January 2025.
Following a period of trading below $2 in August, NEAR experienced a remarkable 283% surge in price over the next two months, fueled by positive market sentiment and increased capital inflow into the crypto AI sector.
However, a recent pullback of 5.4% has brought the price down to the $4.45-$4.70 support zone, with the Sunrise and Near Intent partnership failing to counteract profit-taking pressure.
Is it time to sell NEAR?
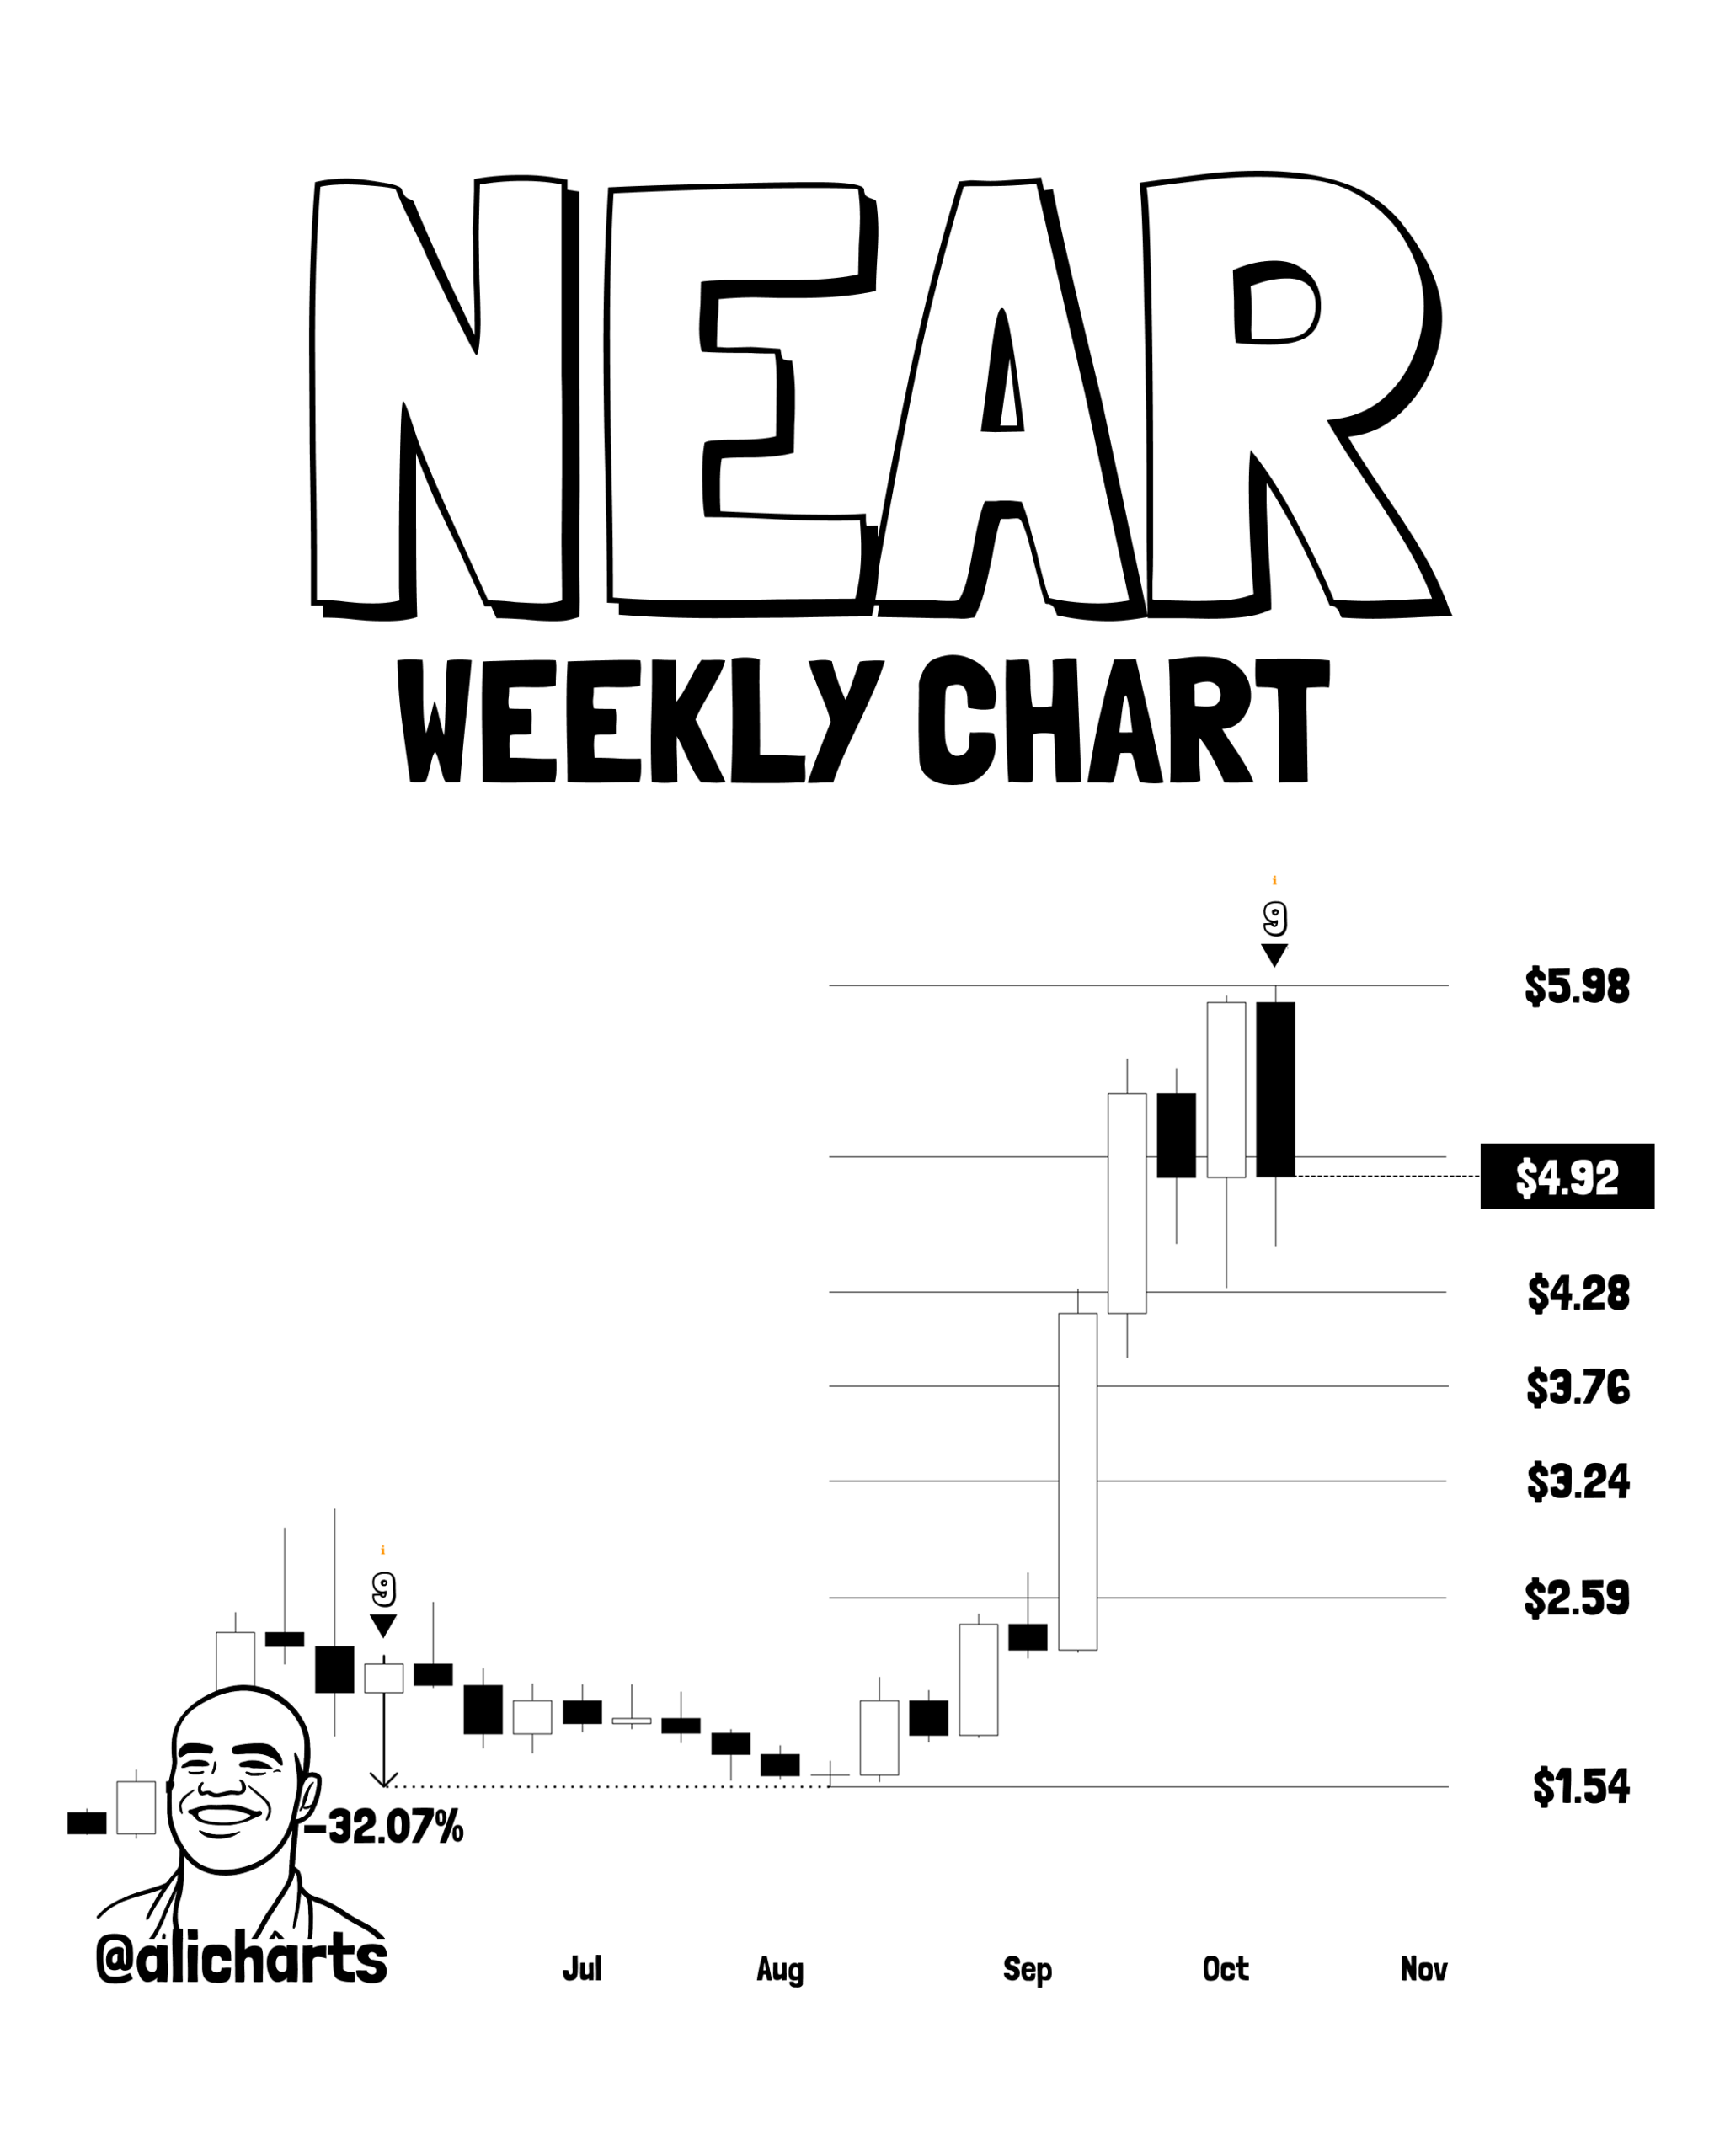
Renowned crypto analyst Ali Martinez has identified a sell signal on the weekly Near Protocol chart using the TD Sequential indicator. Similar sell signals in the past have led to a 32% price correction for the altcoin.
Martinez points out the $4.30 level as a critical support, failure to hold which could see NEAR dropping to $3.76.
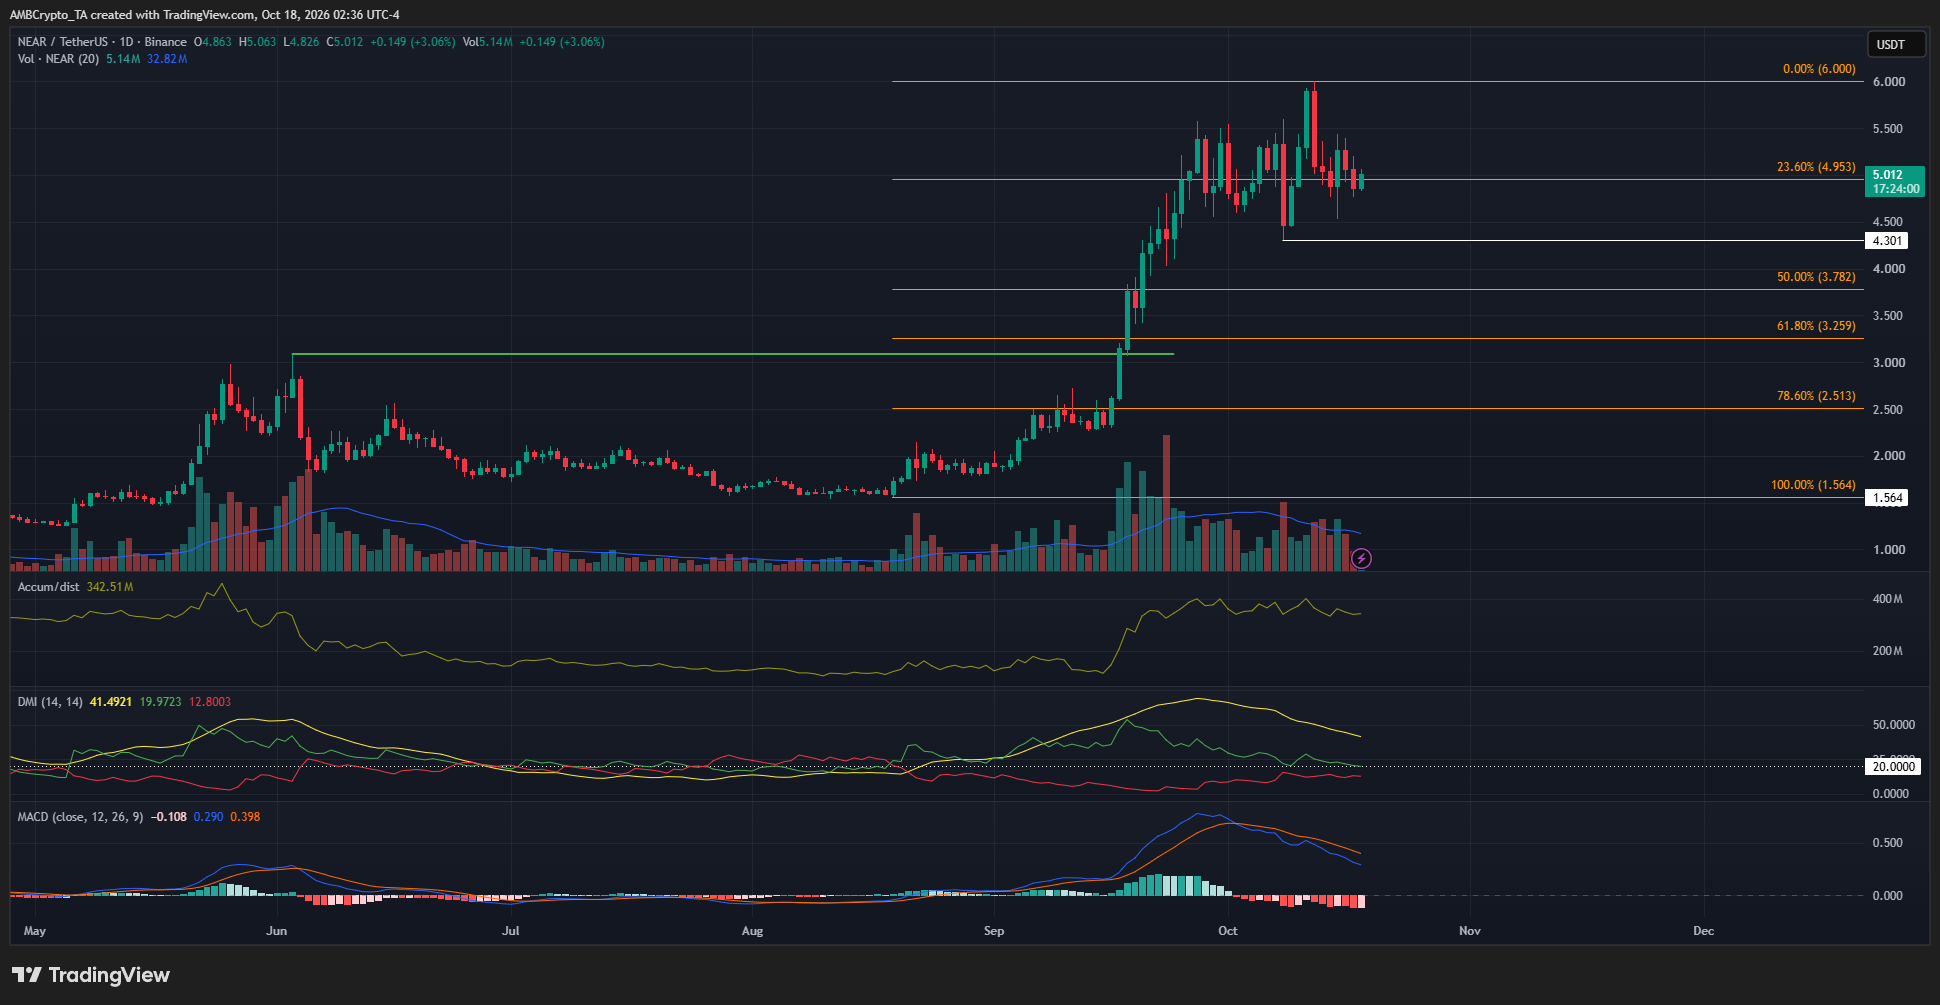
The $4.30 support level established earlier in October has maintained a bullish trend on lower timeframes. The daily chart also reflects a bullish swing structure, suggesting that even a retracement to $2.51 could be a healthy correction.
Indicators like the A/D and DMI signal a weakening uptrend, while the MACD hints at a potential pullback. With the rapid price growth, significant consolidation phases are scarce, making Fibonacci retracement levels a useful tool for long-term investors.
Short-term outlook for NEAR
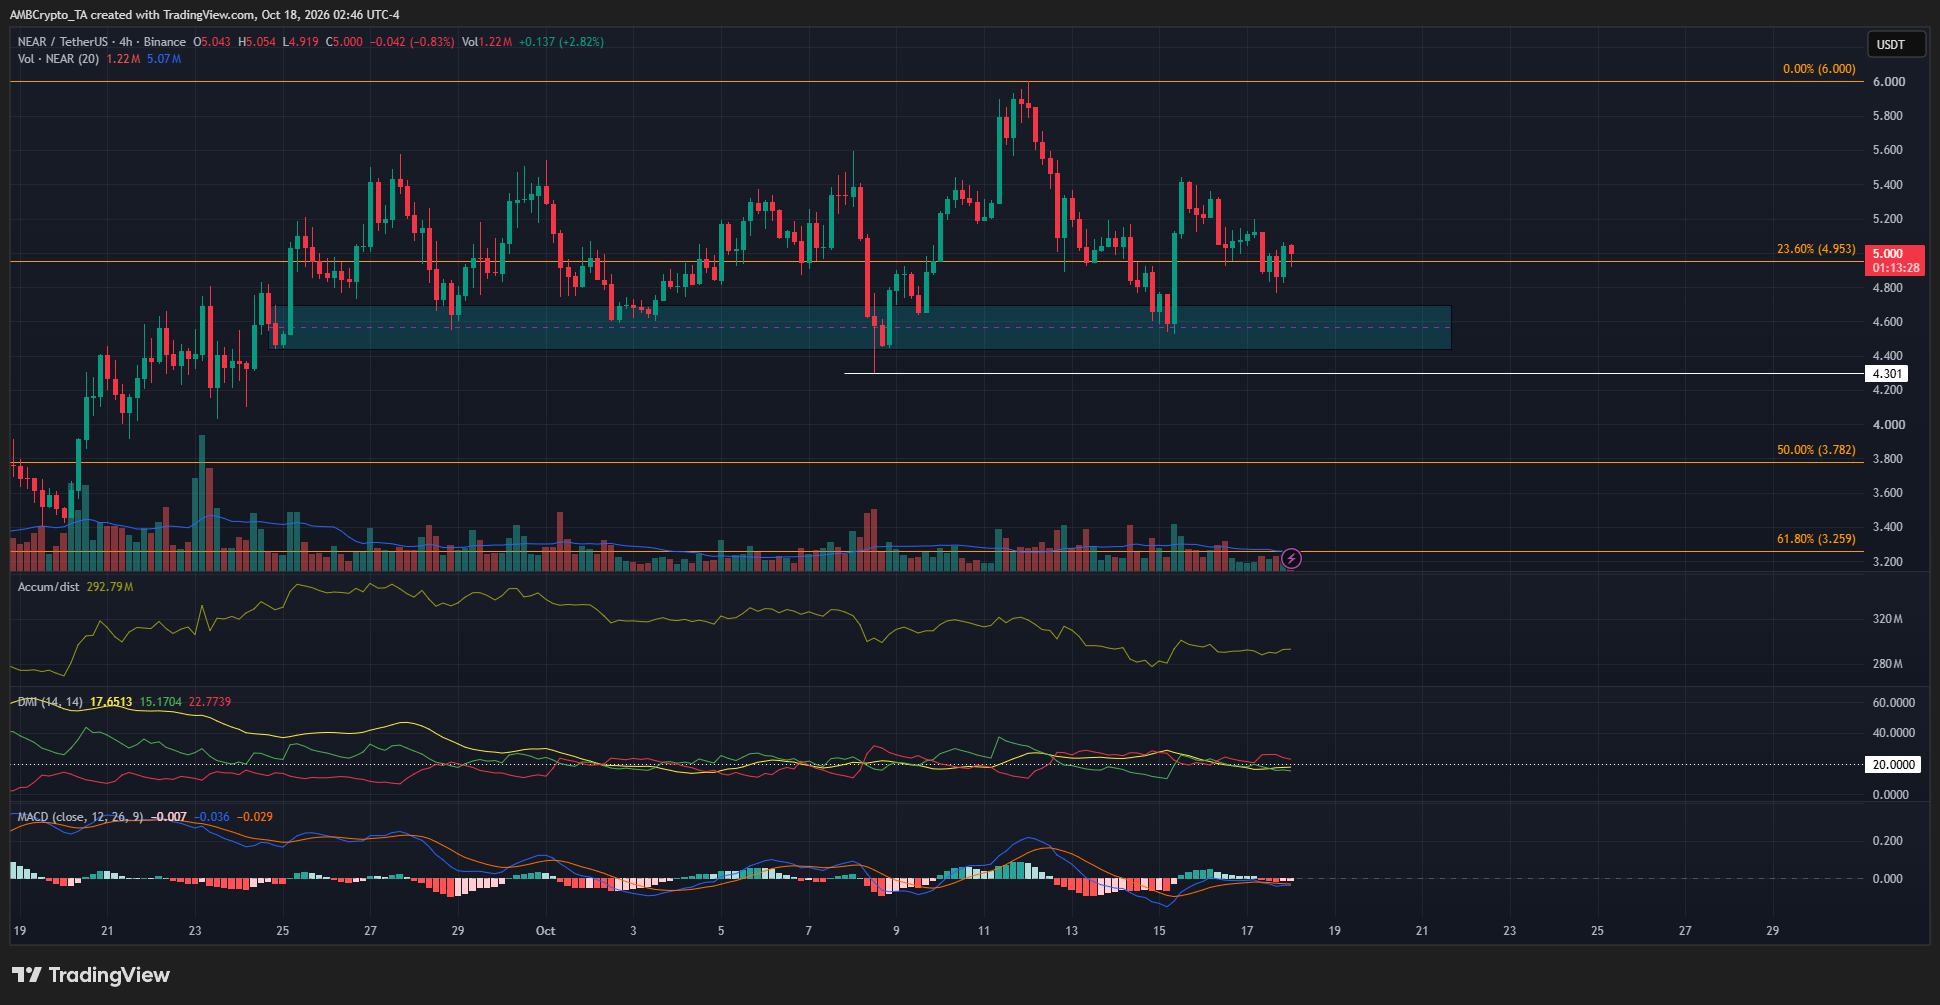
The 4-hour chart highlights a crucial demand zone at $4.60, with NEAR showing resilience in this area despite multiple tests since late September. A close below $4.30 could indicate a deeper pullback, while a break above $6.00 would signal continued bullish momentum.
Key Takeaways
- The strength of NEAR Protocol’s bullish trend has waned, potentially leading to a price correction.
- Long-term investors should monitor the $4.30 support level, considering buying opportunities in the $2.51-$3.26 range.