Polkadot (DOT), a prominent blockchain network that connects different blockchains, may be on the brink of a turnaround. Despite experiencing a significant price drop of nearly 50% from its peak in April, DOT is showing signs of a potential resurgence.
This optimistic outlook is fueled by three main factors: rumors of a DOT-focused exchange-traded fund (ETF) on Coinbase, a bullish technical chart pattern, and strong market liquidity.
Related Reading
ETF Buzz Sparks Investor Interest
Recent reports revealed that Coinbase might be considering a DOT ETF, with the first approval expected on July 15th. This news follows Coinbase’s filing for DOT Futures Contracts, a Futures ETF, and a Spot ETF on June 28th.
The potential for a DOT ETF has generated excitement in the Polkadot community, as ETFs can introduce new investors to the cryptocurrency space, leading to increased buying pressure and higher prices for DOT.

Polkadot: Technical Analysis Suggests Price Breakout
Technical analysis by ZAYK Charts indicates a falling wedge pattern on DOT’s chart, hinting at a potential bullish reversal. The analysis predicts a breakout target around $9.60, signaling a potential gain of over 50%.
ZAYK Charts anticipates a breakout from the falling wedge pattern, with the timing of the breakout being crucial for a potential surge in DOT’s price.
Ample Liquidity Could Enhance Potential Surge
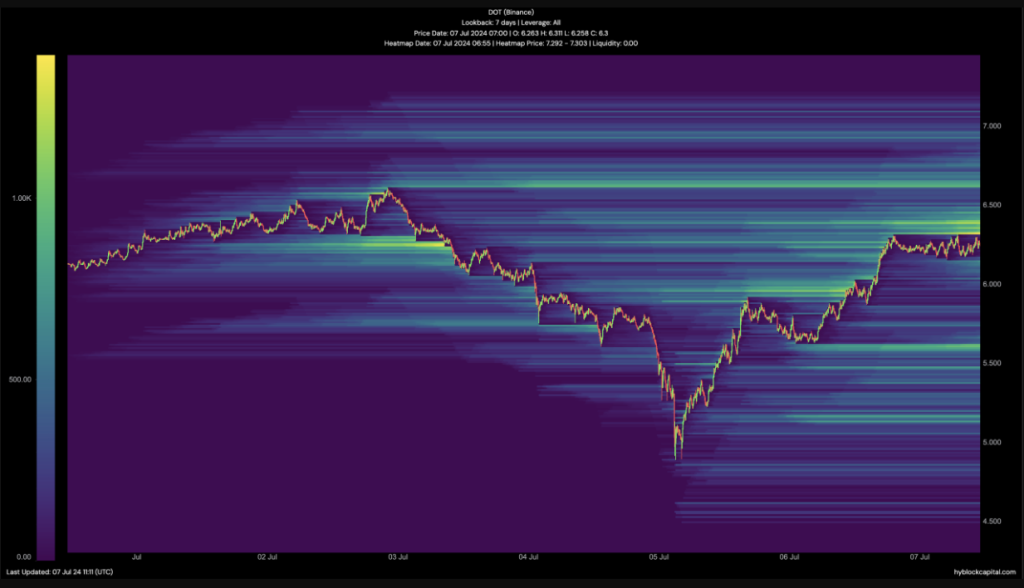
Analysis of liquidity zones for DOT indicates significant liquidity between $6.45 and $6.96, which could support a potential breakout. High liquidity levels can help stabilize price movements and prevent sharp drops.

The presence of ample liquidity in the specified range could contribute to a potential price surge if a breakout from the falling wedge pattern occurs.
Featured image from Shutterstock, chart from TradingView

