

- Ethereum Classic’s Open Interest has decreased significantly from its peak in early February, indicating a decline in trader participation.
- The price of Ethereum Classic has remained below the 50-day MA at $24.82, facing resistance at $23.38 and $25.22.
At the beginning of February, Ethereum Classic saw a sharp rise in Open Interest, surpassing $221 million. However, this momentum has waned, with OI steadily dropping. Traders are now observing whether ETC can regain its strength or continue on a downward path.
ETC’s Open Interest Trends and Market Sentiment
Ethereum Classic experienced a notable shift in Open Interest, exceeding $221 million at the start of February. This surge indicated increased trader engagement and potentially higher market volatility.
As the month progressed, Open Interest showed signs of stagnation, raising concerns about sustaining the initial momentum.
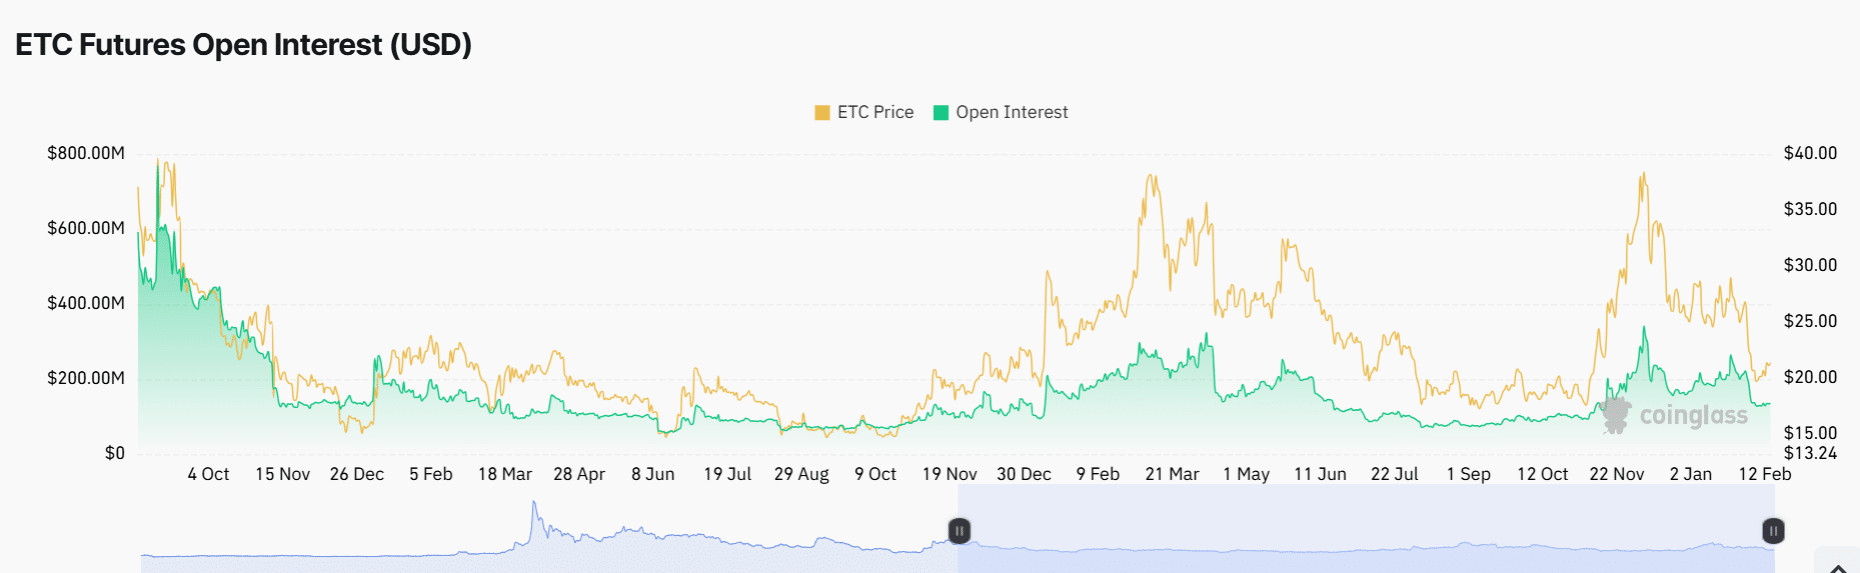
Source: Coinglass
The OI chart revealed a peak in early February, reaching over $221 million, followed by a gradual decline. This decline corresponds with a cooling phase in ETC’s price action, reflecting reduced speculative positioning. Currently, OI stands at around $134 million.
Historically, rising Open Interest and prices indicated strong market conviction, while a decline may suggest diminishing enthusiasm or profit-taking.
ETC Price Action: Key Levels to Watch
ETC’s price has been fluctuating recently, struggling to maintain a strong upward trend. The recent price action shows consolidation around the $21 level after facing resistance near $24.82 (50-day MA).
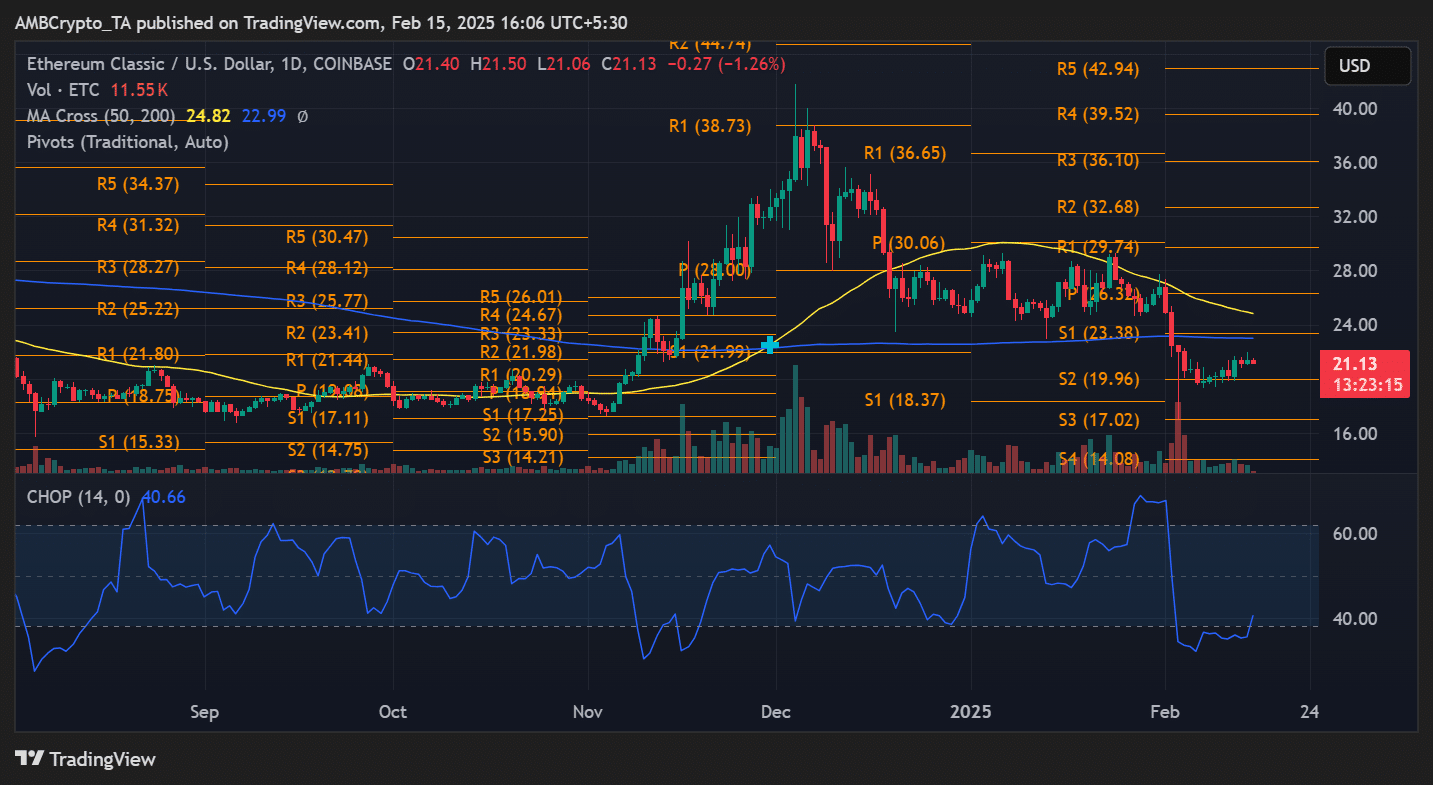
Source: TradingView
The 200-day moving average at $22.99 is another significant threshold. A breakout above this level could signal a resurgence in bullish sentiment. However, failure to breach these resistance zones could lead to a retracement towards $19.96 (S2 pivot).
The Chop Index reading of 40.66 suggests moderate market choppiness, indicating an indecisive trend direction in the short term.
Trading Volume and Market Strength
Volume analysis shows a surge in trading activity at the start of February, aligning with the OI increase. However, trading volume has since declined, potentially signaling reduced investor interest.
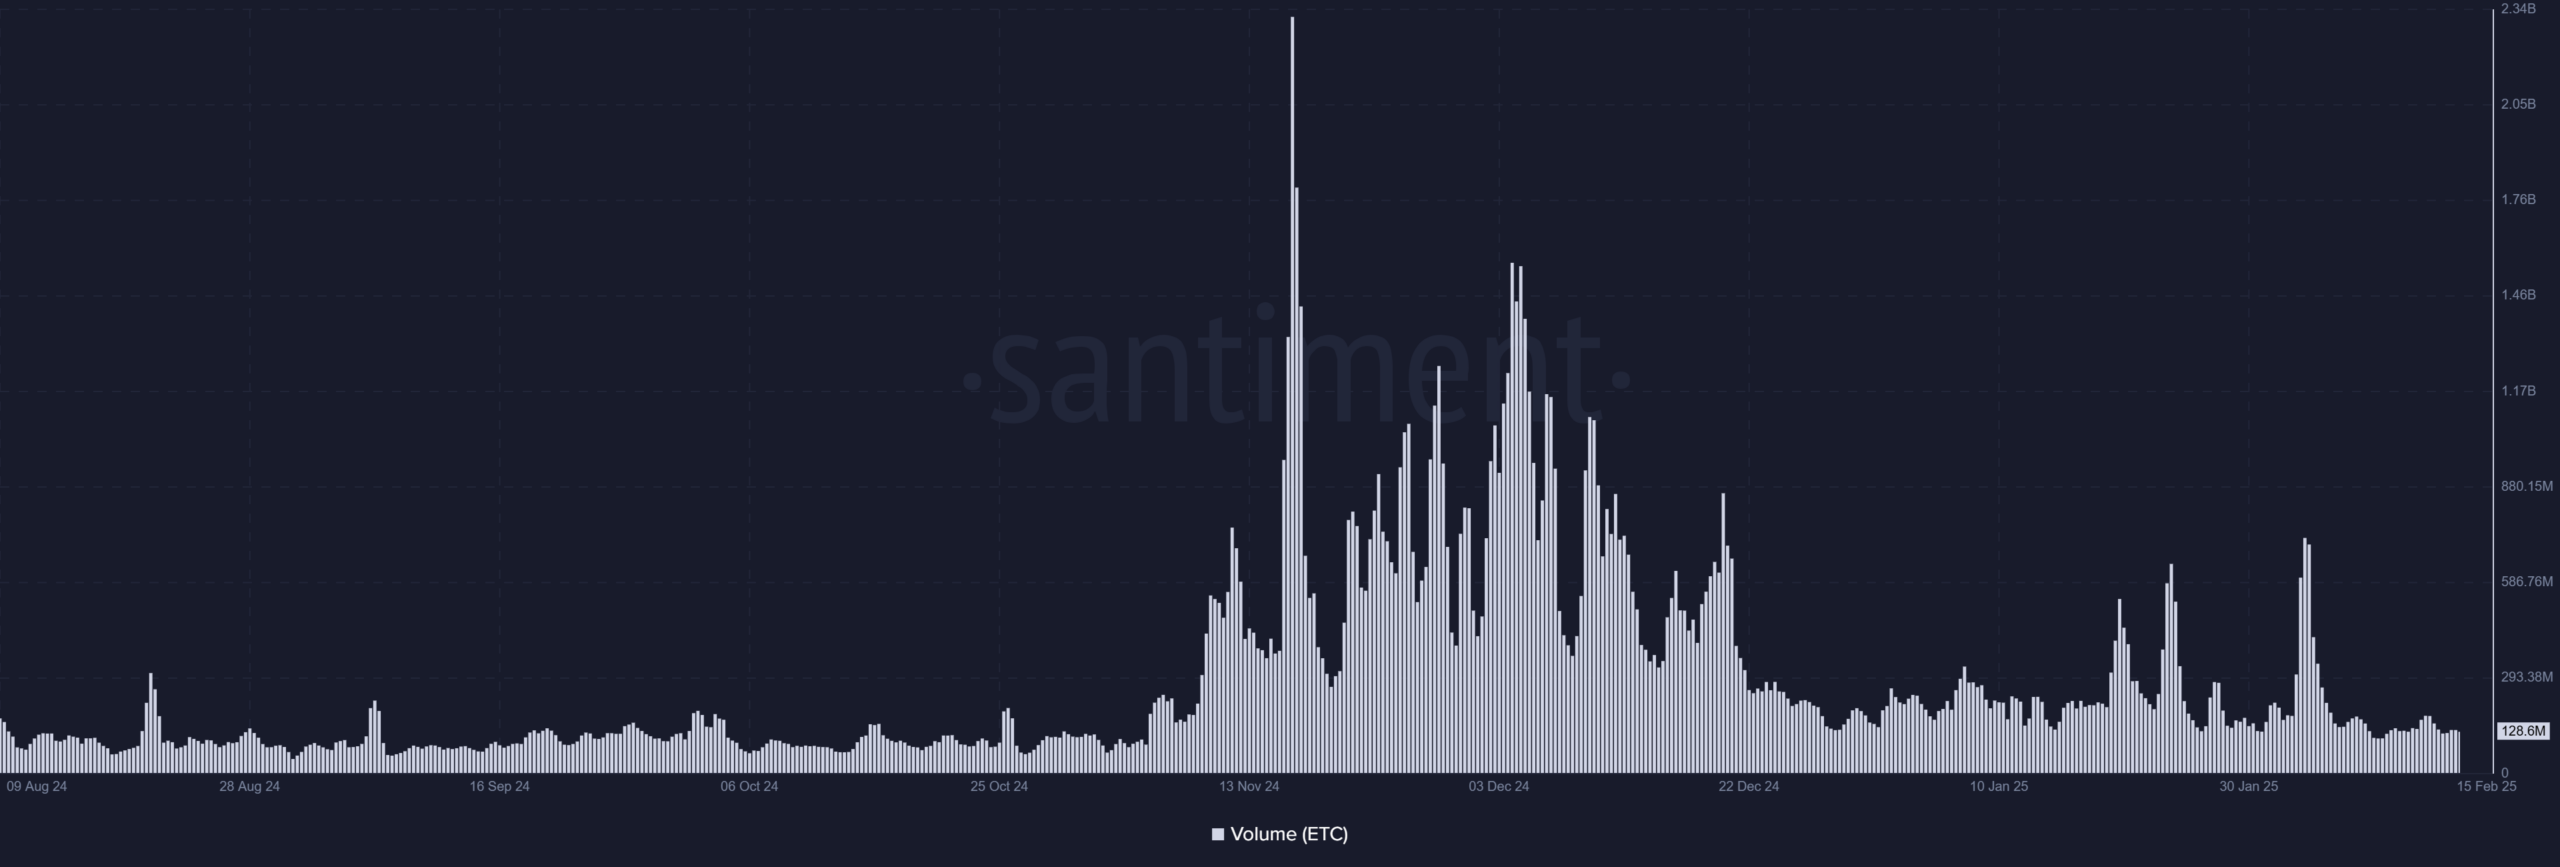
Source: Santiment
Low volume during ETC’s consolidation phase may indicate traders awaiting a clear direction before making significant moves. A sudden volume increase could trigger price volatility.
What’s Next for ETC?
The decline in Open Interest and price consolidation suggest Ethereum Classic is at a critical juncture. A break above key resistance levels of $24.82 and $22.99 could revive bullish momentum.
On the downside, failure to hold above $21 could lead to further selling pressure, testing the $19.96 support level. Monitoring volume trends and OI changes in the coming days is crucial to assess the sustainability of potential price movements.
As ETC navigates this consolidation phase, market participants are cautious, anticipating a definitive breakout or breakdown to determine the next trend direction.
following sentence:
The dog ran quickly through the park.
Rewritten sentence: The dog sprinted through the park with speed.