

- ETH experienced its steepest decline since the days of the FTX collapse, as seen in the weekly recap.
- Leveraged liquidations likely played a significant role in influencing ETH’s performance.
Ethereum [ETH] went through a period of intense volatility over the past week, resulting in a significant drop that erased any bullish sentiment that had been building up towards the end of July. Let’s delve into how ETH performed during this tumultuous time.
Despite showing overall bullishness in July, ETH faced a slight pullback in the last week of the month. This was followed by a brief attempt at recovery, only to be met with strong selling pressure that dominated the following week.
ETH recorded a continuous decline over the past 7 days, culminating in a total drop of 36.59%.
The last time ETH saw such a rapid decline in such a short span was back in June during the FTX collapse of 2022. At the time of writing, ETH was trading at $2,277.
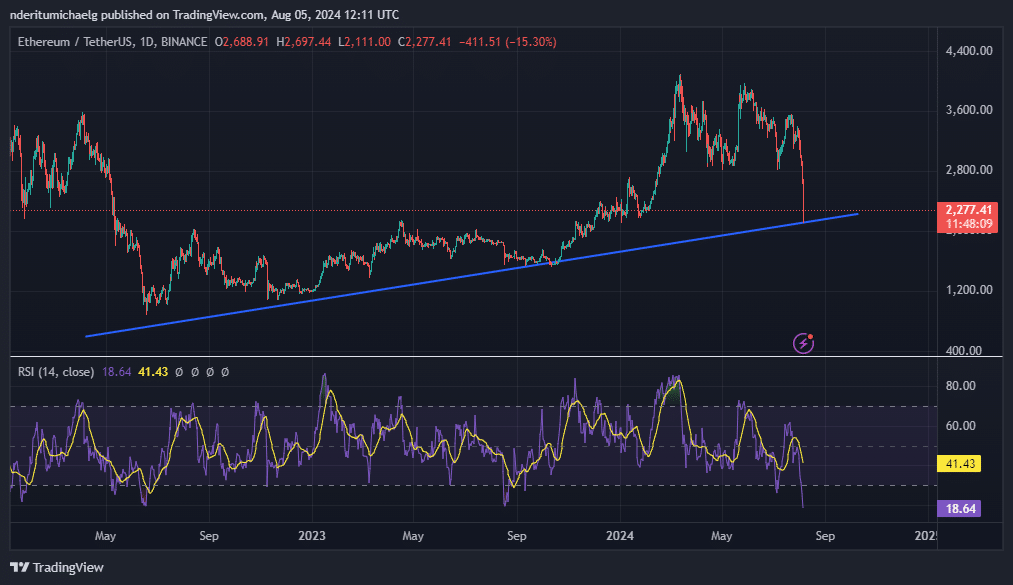
Source: TradingView
The recent surge in selling pressure has raised concerns about the possibility of further downside in the coming weeks. While a bearish scenario is likely, there is a chance for a bullish resurgence.
Several indicators pointed towards a potential recovery for ETH. For instance, the price reached oversold levels according to the RSI.
Additionally, the recent significant pullback retested a key ascending support level, leading to some accumulation. ETH had already bounced back by 5% from this support level.
Analysis of Ethereum exchange flows revealed interesting insights. Over 501,000 ETH were withdrawn from exchanges in the last 24 hours, marking the highest outflow in a single day in the past month.
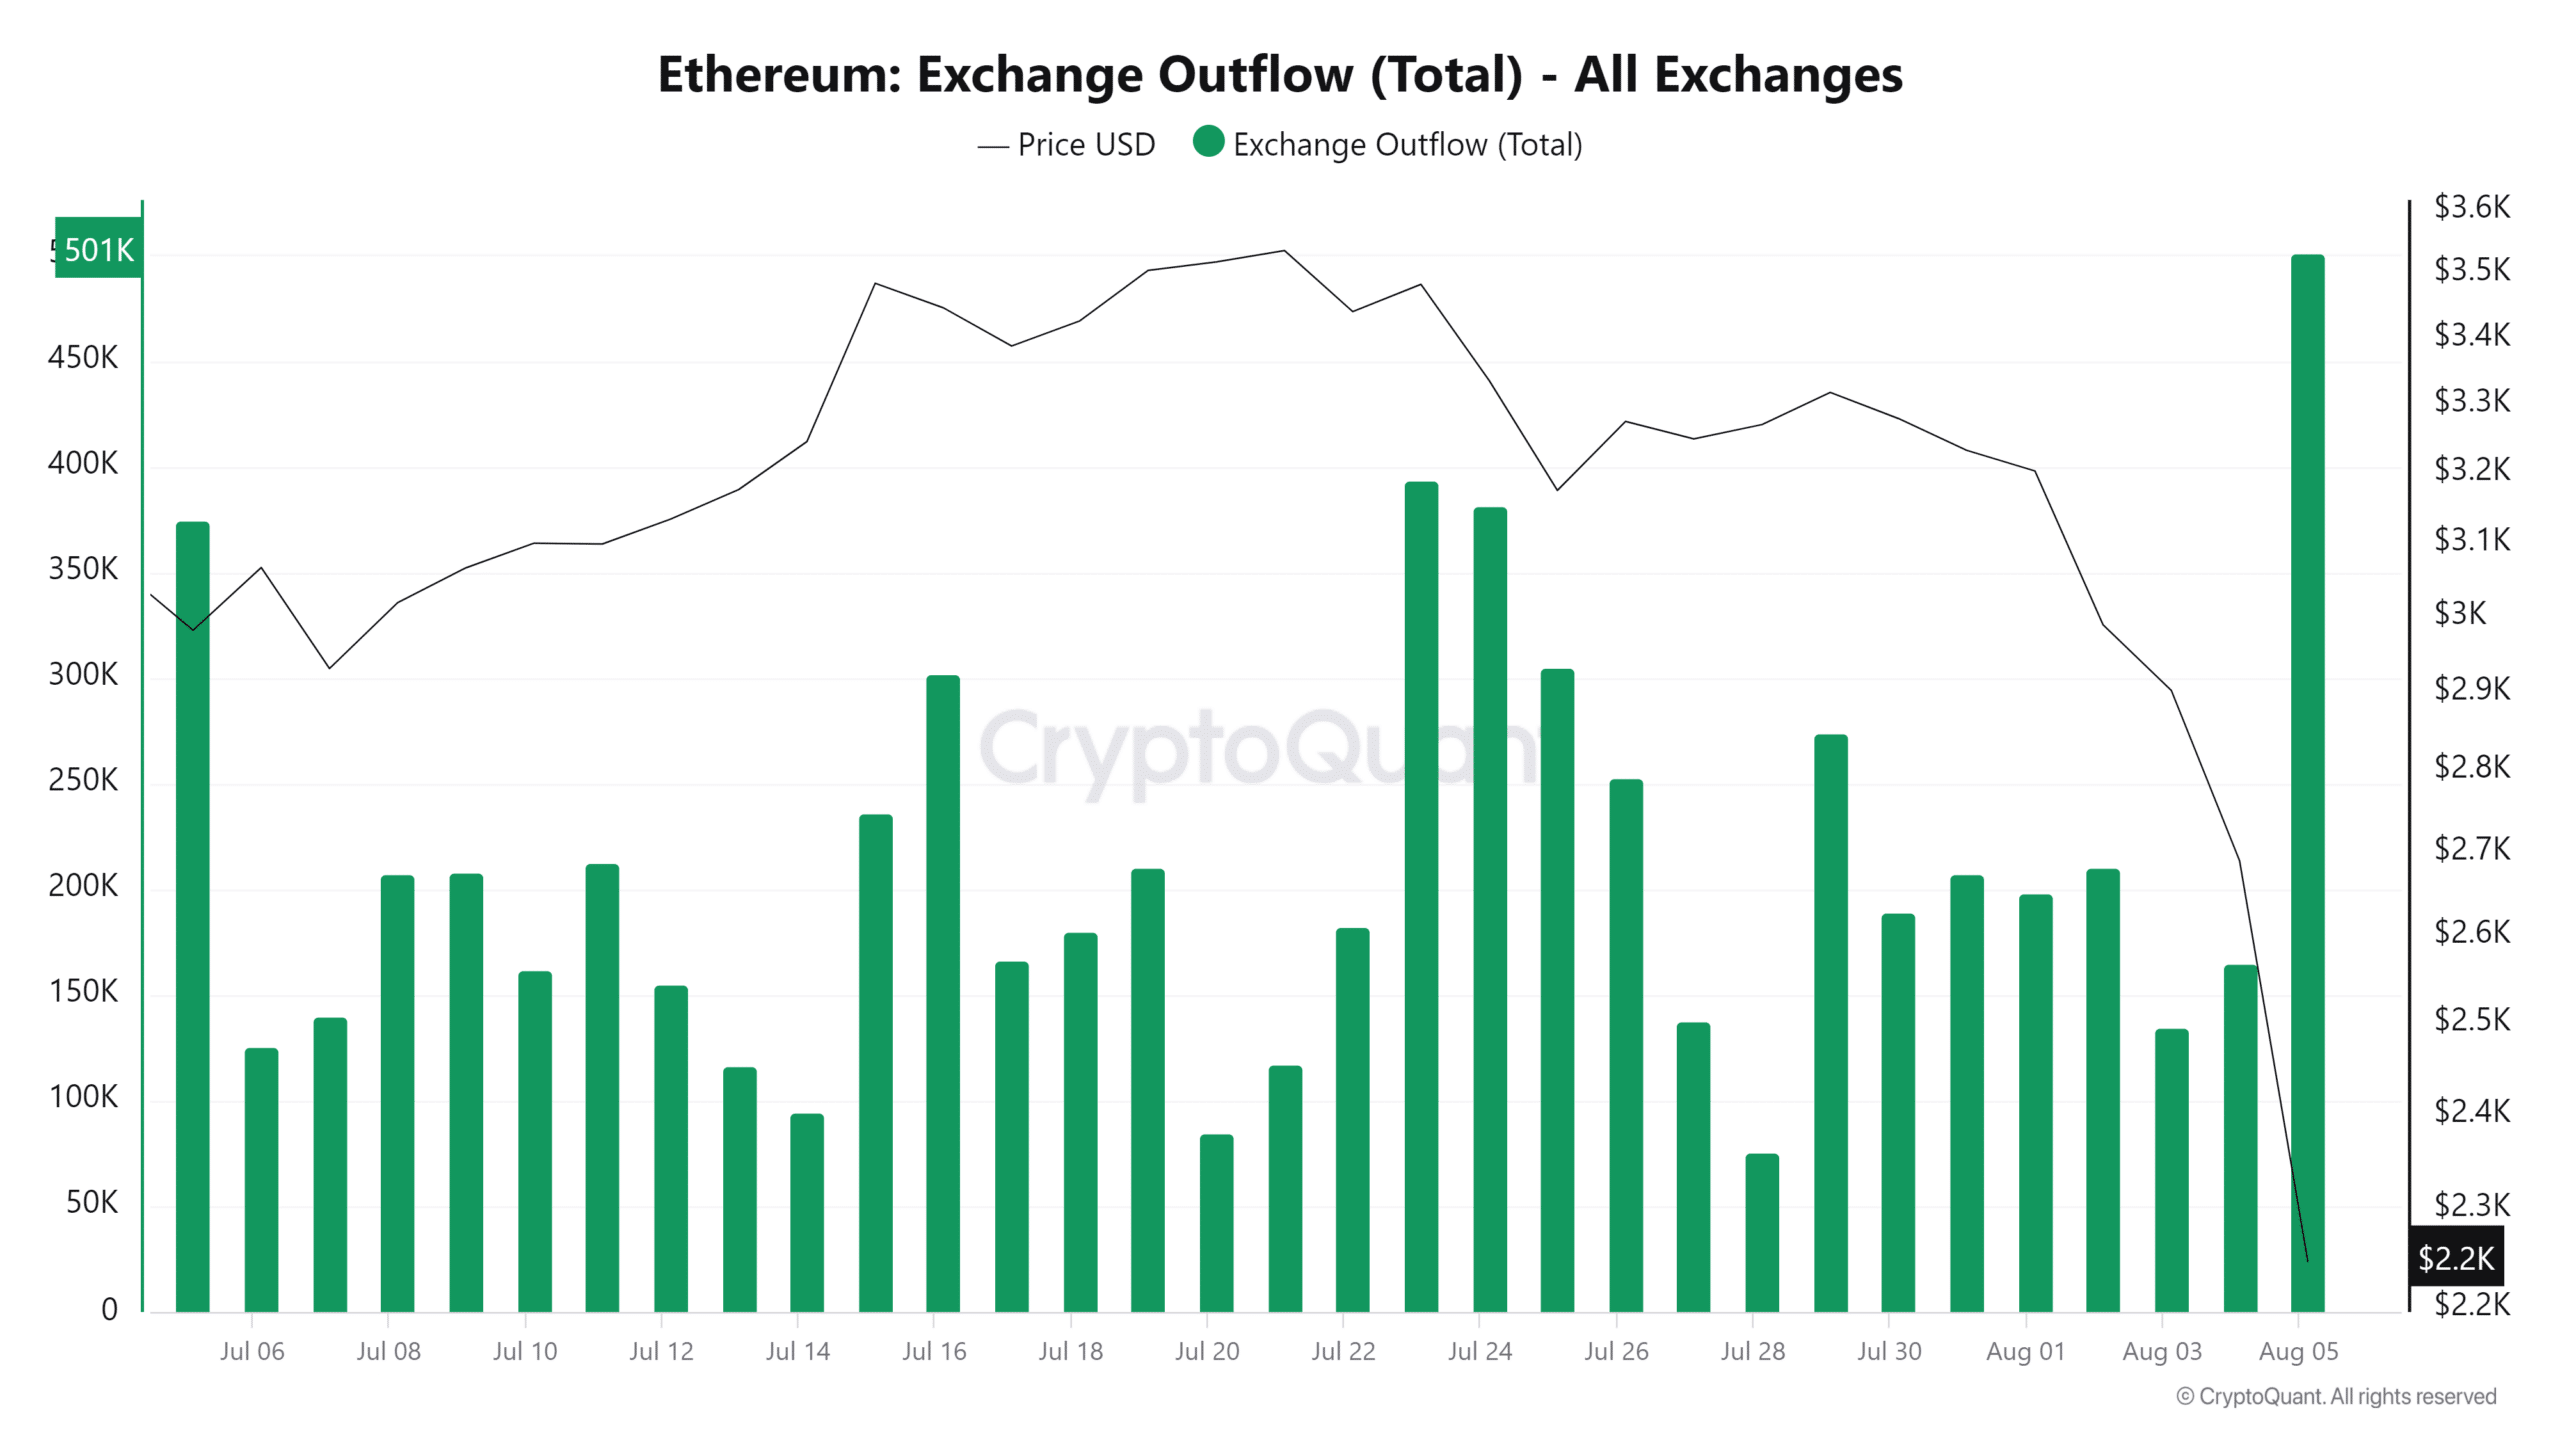
Source: CryptoQuant
In contrast, there were 446,877 ETH in exchange inflows during the same period, marking the highest inflows in the past month.
This imbalance in outflows and inflows resulted in a net outflow of approximately $119 million in dollar value.
The exchange flows data suggest a potential recovery in demand at discounted prices, with the possibility of a significant bounce back if selling pressure subsides.
Derivatives data indicated a spike in long liquidations over the past 24 hours. The total value of long liquidations reached $141.2 million, the highest daily figure recorded in the past month.
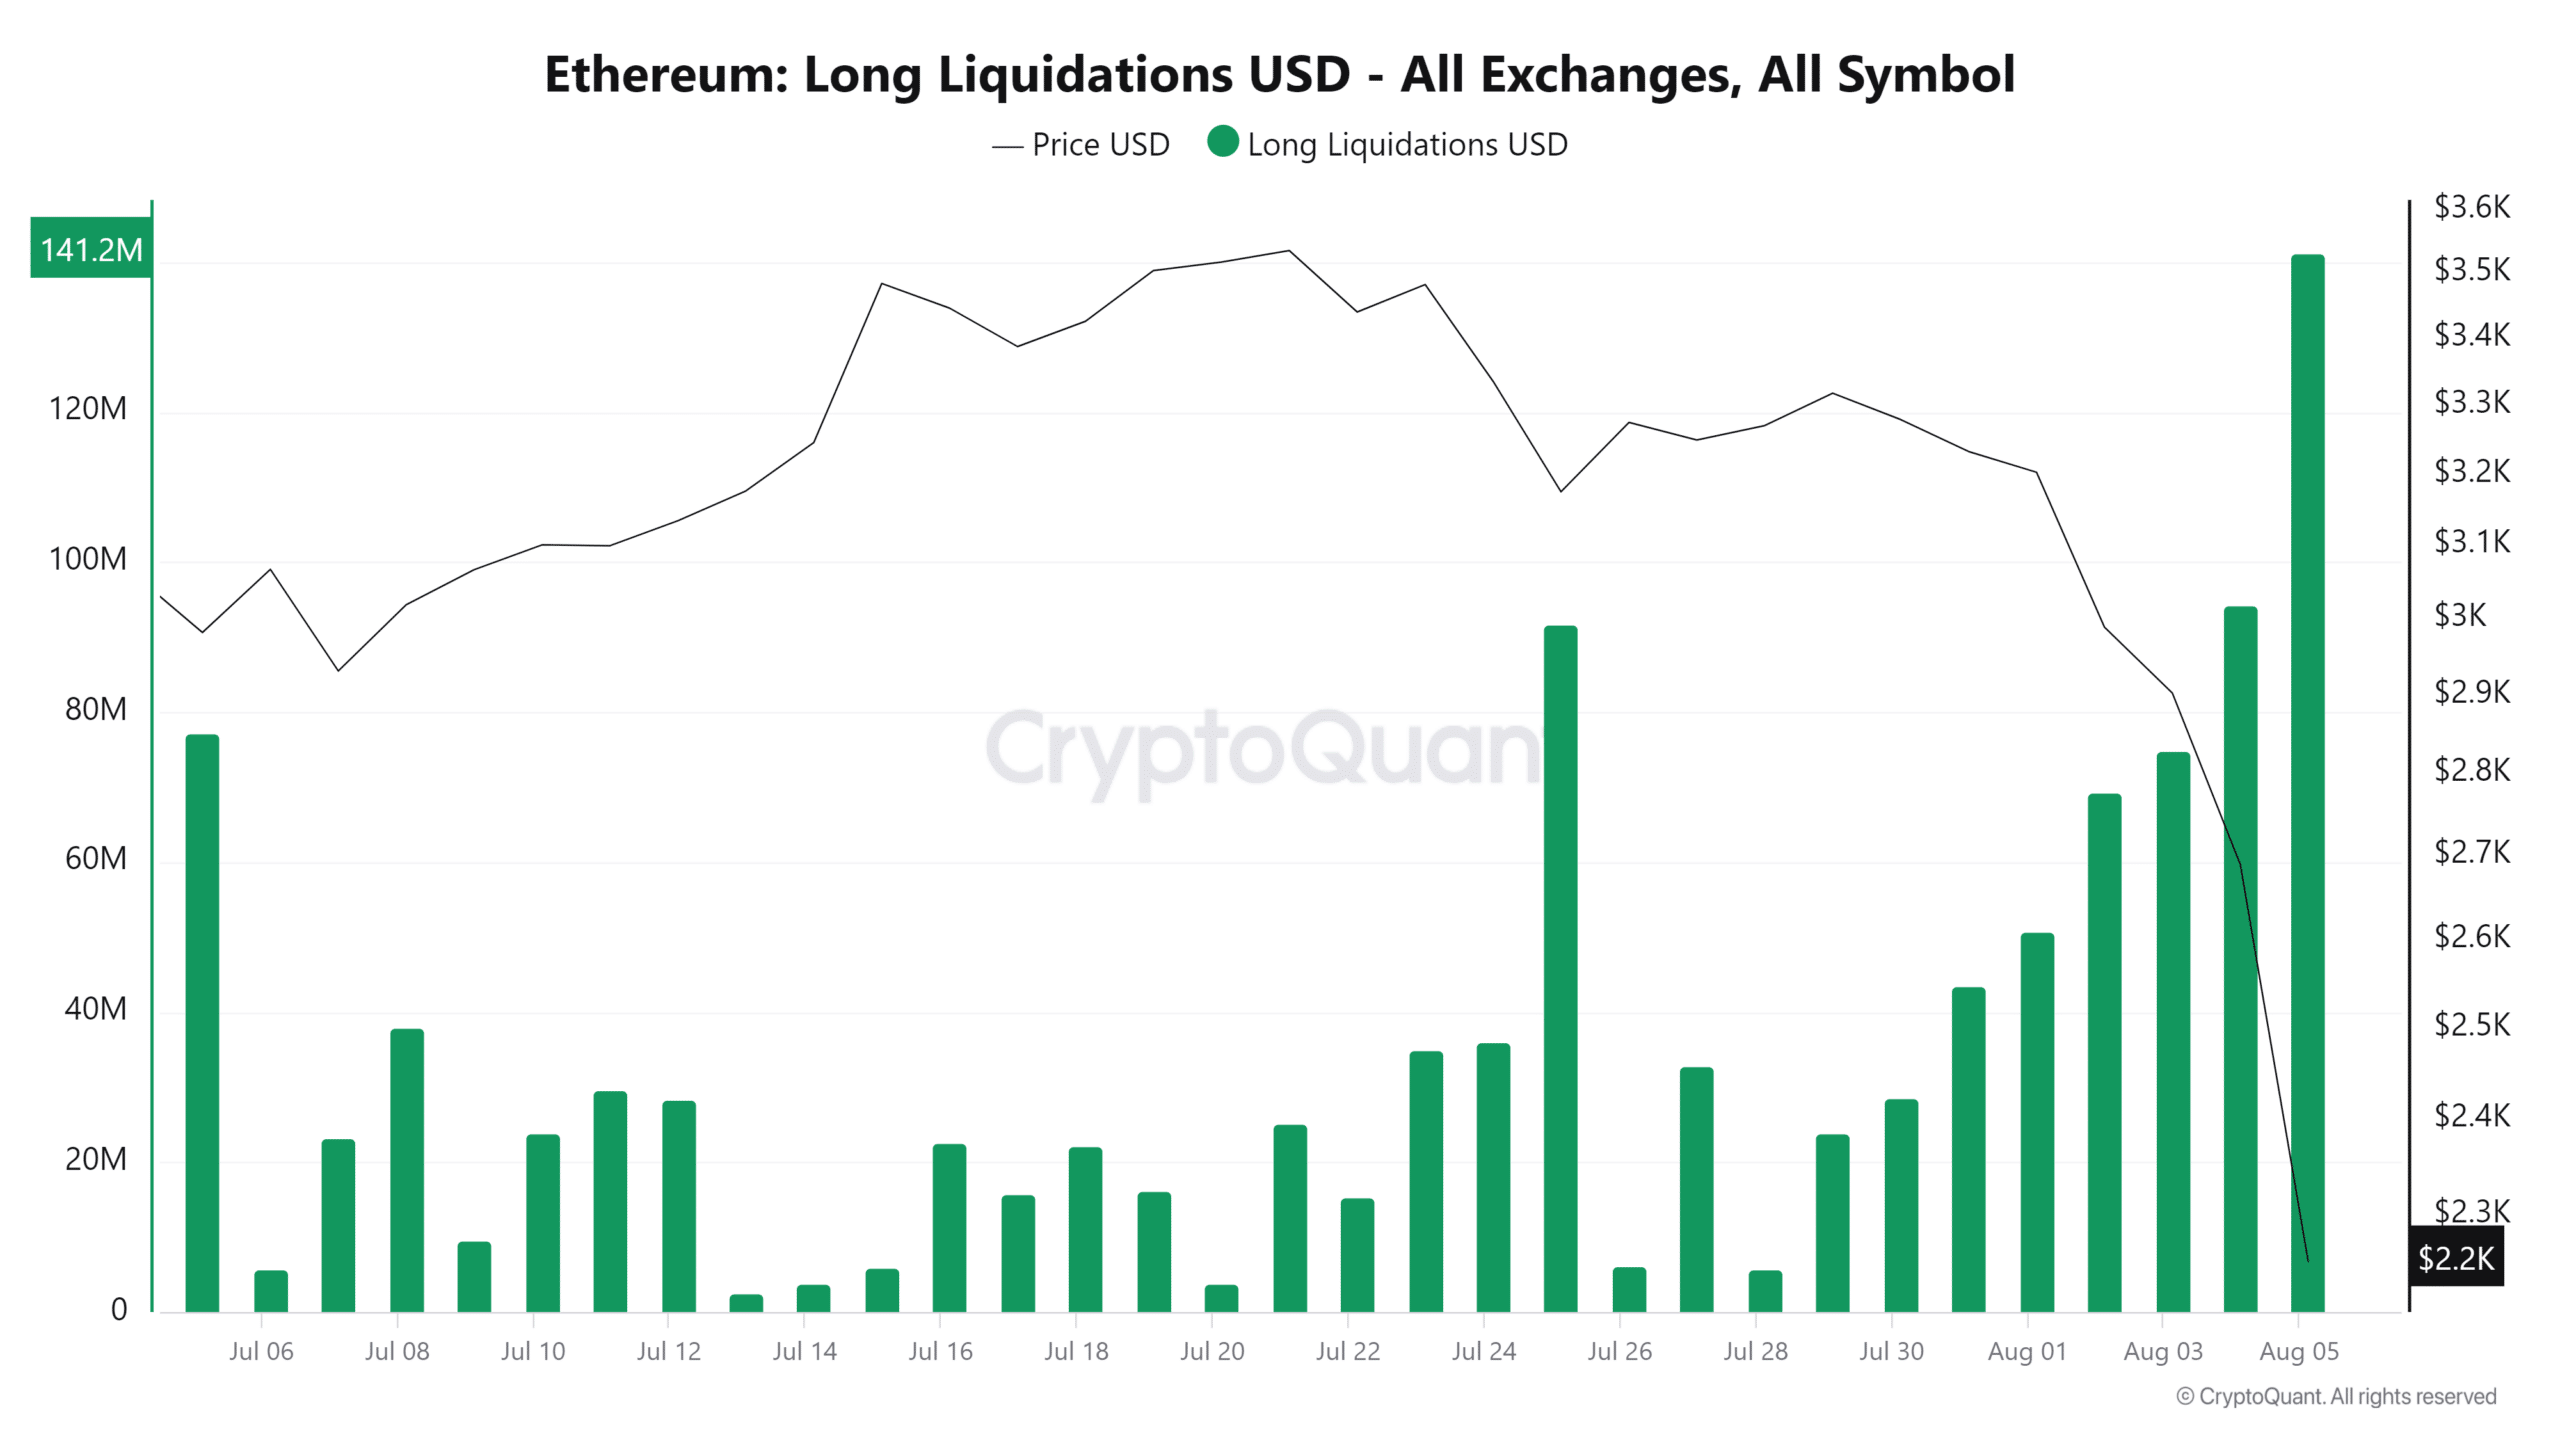
Source: CryptoQuant
In contrast, short liquidations in the last 24 hours were significantly lower at $35.5 million. Margin calls on leveraged long positions may have contributed to the additional downside observed during this period.
Read Ethereum (ETH) Price Prediction 2024-25
This could have also added to the heightened volatility, especially considering the increased appetite for leverage seen in the past week and the subsequent liquidations.
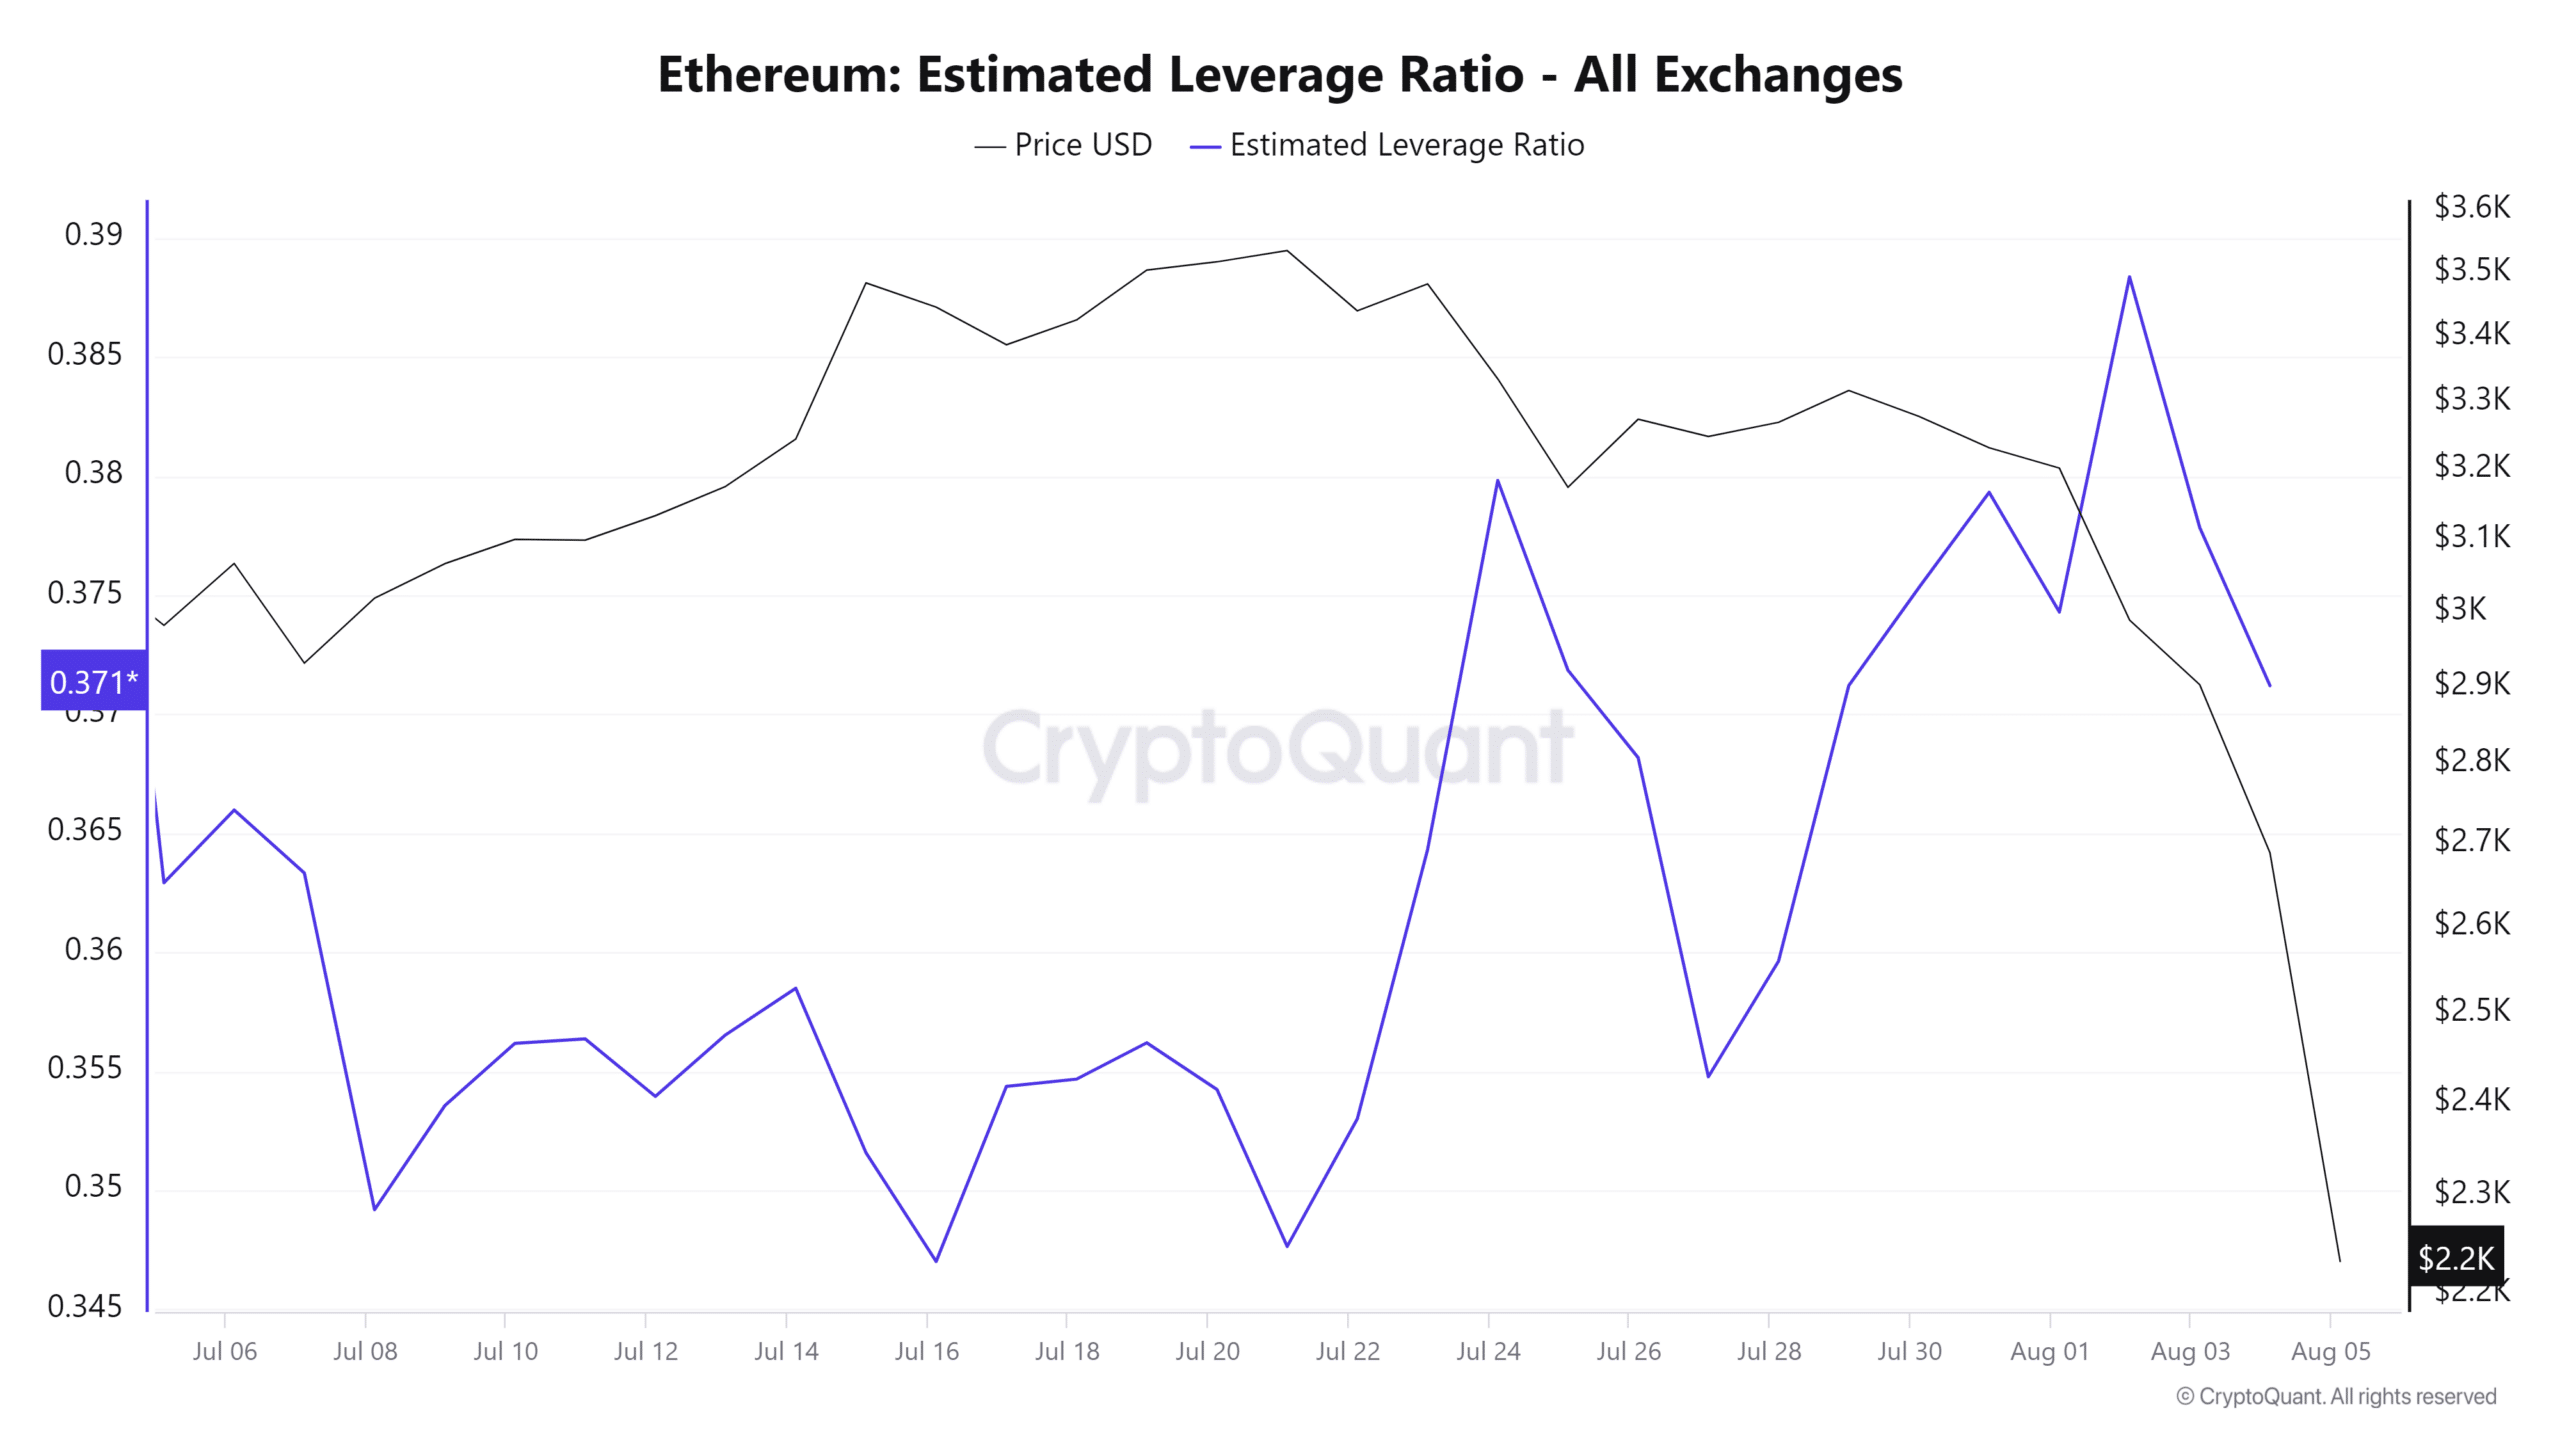
Source: CryptoQuant
With recent margin calls helping to deleverage the market, it is expected that volatility may decrease. However, the direction of the market will likely depend on external factors such as demand and selling pressure.
sentence: Please remember to turn off the lights before leaving the room.
Don’t forget to switch off the lights when you exit the room.