

- Ethereum’s price has surged to $2,350, with technical indicators pointing towards a potential rally up to $3,260
- Analysis of altcoin netflows suggests a shift in market sentiment
Traders are closely monitoring Ethereum’s price action as key indicators signal a possible significant uptrend. The cryptocurrency has shown resilience by reclaiming important price levels and displaying patterns that have historically preceded strong rallies.
Ethereum has successfully reclaimed the $2,350 mark, with technical indicators supporting a potential rally towards $3,260. As of March 6, ETH was trading at $2,203.57, with a realized price of $2,075.57.
The pricing bands for the altcoin have indicated crucial levels, with ETH breaking above a significant threshold, signaling strong bullish momentum.
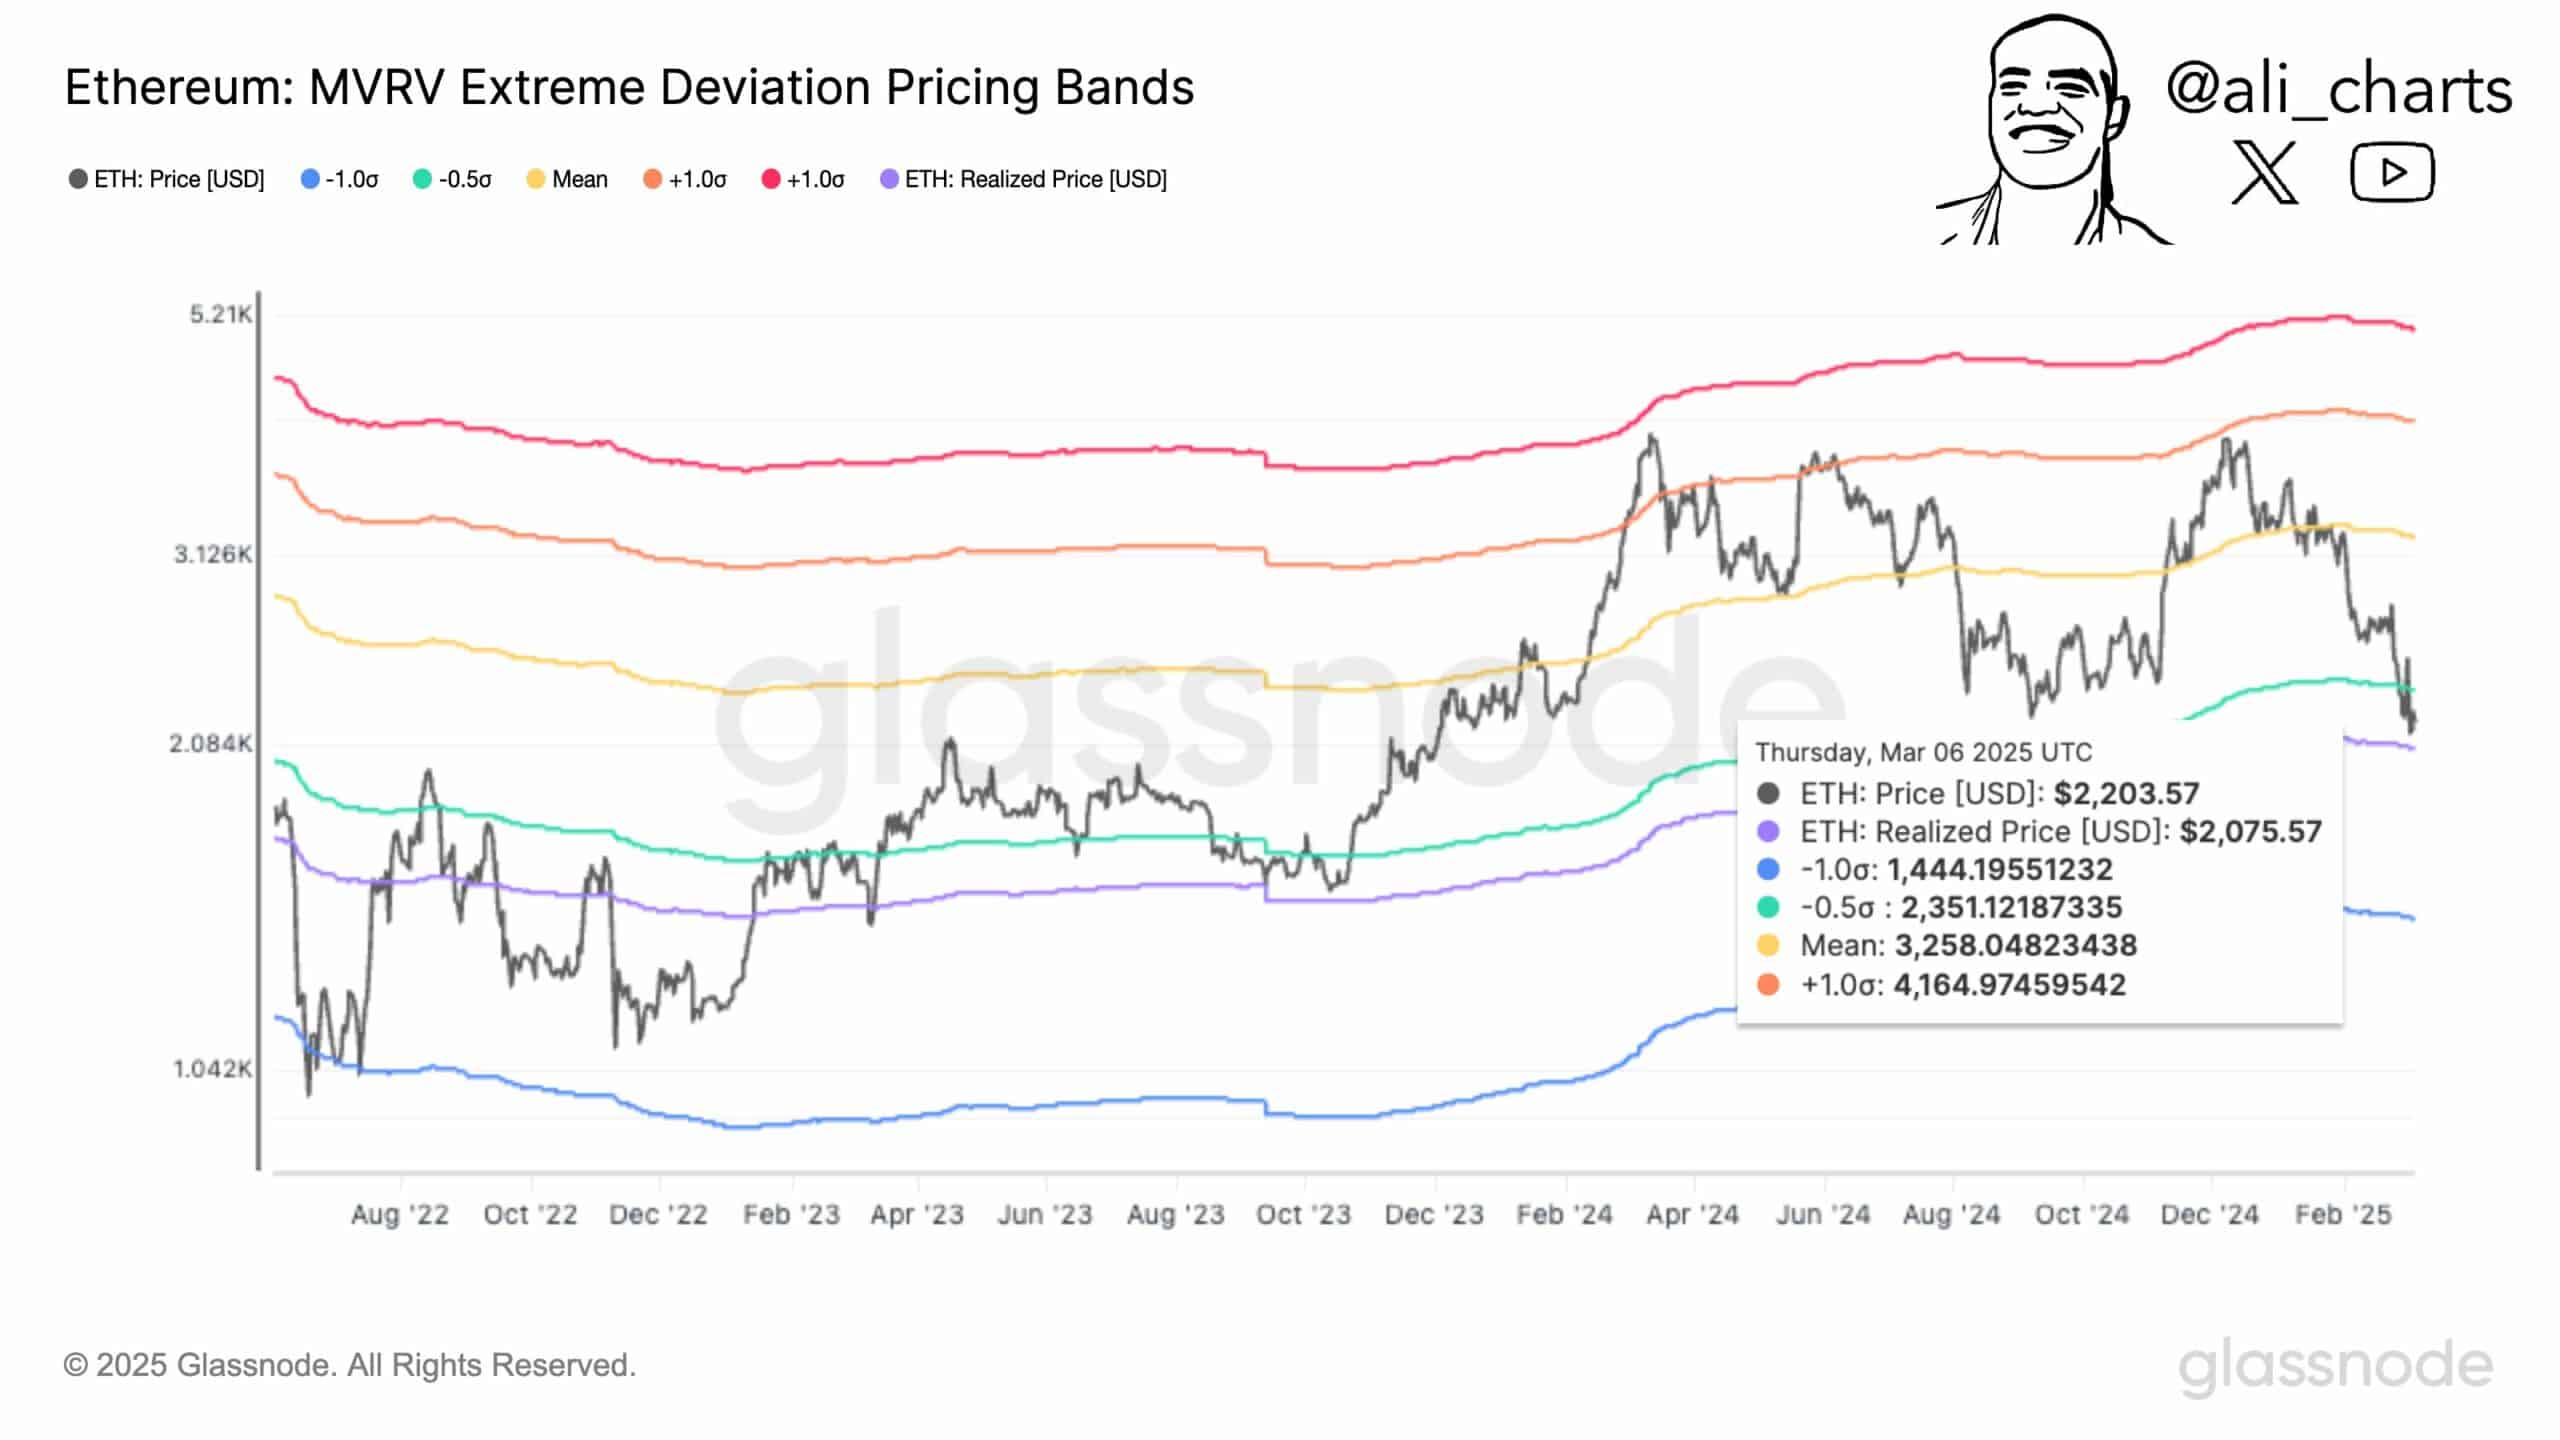
Source: Glassnode
Historical data shows that previous breakouts have led to significant price surges, such as the rise from $1,042 in August 2022 to $3,126 by August 2024. This pattern suggests that ETH’s recent movement indicates accumulation and reduced selling pressure.
A potential rally to $3,260 could offer a 48% upside. However, a failure to hold above $2,351 might lead to a decline towards $1,444, a possible 34% decrease.
What Do Exchange Withdrawals Signify?
Over $500 million worth of ETH has been withdrawn from exchanges, indicating an increase in accumulation among traders. The outflow volume chart on March 8 showed a 24-hour change of +70.29%, a 7-day change of -10.08%, and a 30-day increase of +13.23%.
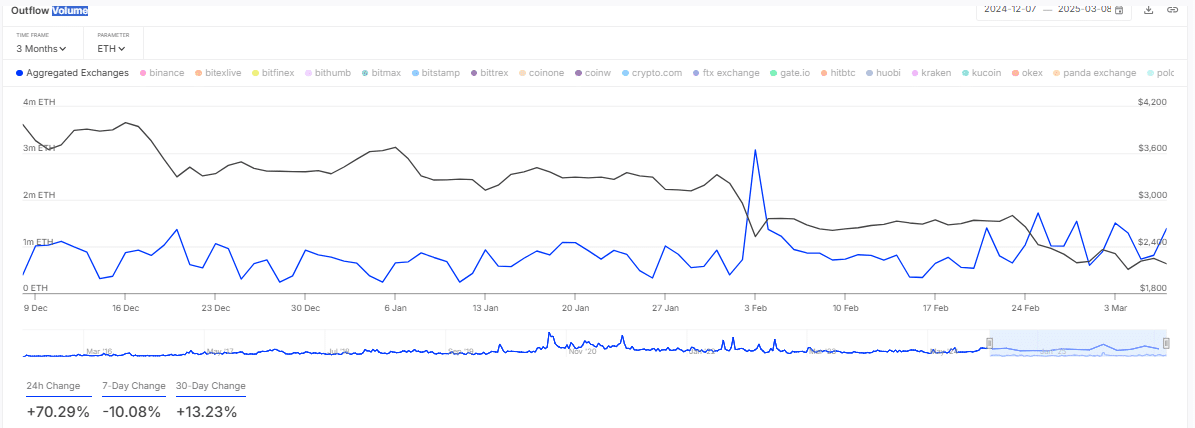
Source: IntoTheBlock
On March 3, outflows peaked at 1 million ETH, valued at $2.4 billion, before decreasing to 400k ETH by March 6. The sharp 24-hour surge reflects strong buying pressure, reducing the available supply on major exchanges.
The long-term accumulation pattern indicated by the 30-day trend often precedes price hikes, while the 7-day decline suggests short-term profit-taking that could temporarily slow momentum.
This pattern resembles early 2024 when outflows preceded a 20% price increase. Continued outflows could push ETH towards $2,600, while a return of selling pressure could test $2,200 on the charts.
Bearish Signals in Outflow Trends
Analysis of Ethereum’s netflows has revealed shifting market sentiment.
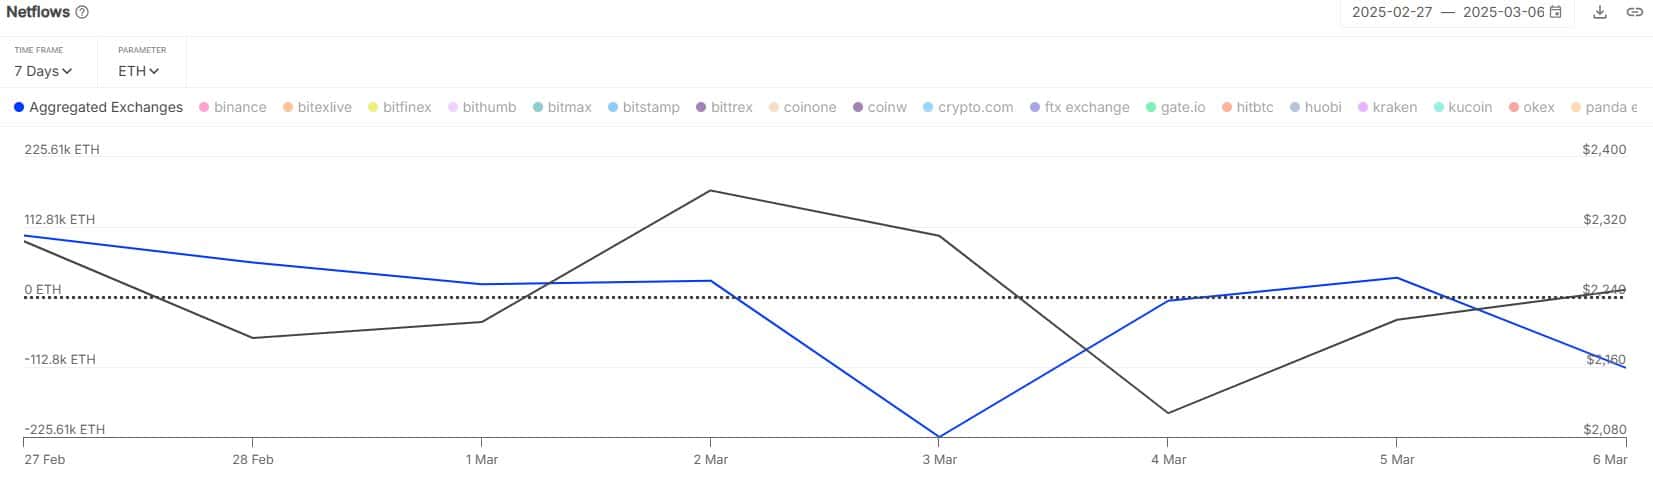
Source: IntoTheBlock
Net outflows peaked at -225.61K ETH on March 5, equivalent to $540 million at $2,400 per ETH, before decreasing to -112.81K ETH the following day. The declines in 7-day and 30-day netflows suggest ongoing accumulation, reducing the available supply on platforms like Coinbase and Kraken.
This trend has historically preceded rallies, as seen in February 2024 when a similar outflow pattern led to a 15% price surge. Continued accumulation could push ETH to $2,800, but inflows surging might increase selling pressure and push ETH down to $2,100, indicating a potential reversal.
A Positive Outlook for the Altcoin?
At present, Ethereum’s trajectory appears bullish, supported by strong technical indicators and accumulation trends. With ETH trading at $2,203.57, there are projections of a potential rise to $3,260, marking a 48% increase.
Exchange withdrawals reaching 400k ETH, valued at $960 million, along with negative netflows, indicate reduced selling pressure. Historical data suggests that ETH surged by 20% in 2024 following similar patterns, hinting at a move towards $2,800 by mid-March.
If ETH maintains its position above $2,351, further upside could be expected. A drop below $2,200 may signal a correction towards $1,444, reflecting a potential 34% decline.
following sentence: The quick brown fox jumps over the lazy dog.
The speedy brown fox leaps over the lethargic dog.