

Trader IncomeSharks believes that Dogecoin’s daily chart is showing signs of a potential breakout, as indicated by a rising channel and an on-balance volume (OBV) wedge. The analyst shared a chart highlighting these patterns, suggesting that a breakout in OBV could lead to higher price levels.
Watching for a Dogecoin Breakout at $0.33
Since early summer, Dogecoin has been following a well-defined ascending channel, with clear boundaries that have been respected by price action. The recent rebound off the rising support area in early October has brought DOGE back into the channel’s mid-range, where it typically consolidates before making a move higher.
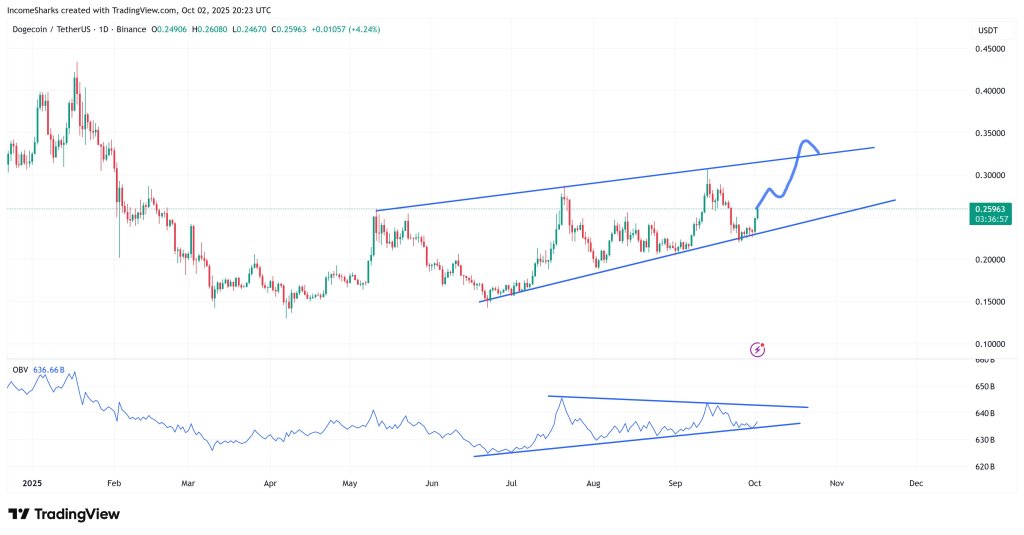
IncomeSharks predicts a brief consolidation or shallow pullback within the channel, followed by a potential move towards the upper boundary. The key breakout level to watch is between $0.32 and $0.33, where a decisive daily close above this range could signal a bullish breakout and pave the way for a push towards the previous high at $0.4843.
The analyst emphasizes the importance of monitoring volume dynamics, particularly the OBV, which shows a tightening range that often precedes a significant price movement. An OBV breakout before price could indicate strong accumulation and increase the likelihood of a continued upward trend.
As long as Dogecoin maintains the rising support line, the path of least resistance remains upwards within the channel. A clean break in OBV would further support this bullish view. However, a failure to hold the support level could invalidate the channel thesis and lead to a retest of lower levels.
Currently trading at $0.2559, Dogecoin’s price action will be crucial in determining whether the anticipated breakout scenario plays out as outlined by IncomeSharks.
Image credit: DALL.E, chart from TradingView.com