- Simon’s Cat (CAT) recently entered a phase of price discovery and reached its all-time high on September 21st.
- Key technical indicators suggest a potential slowdown in the near future.
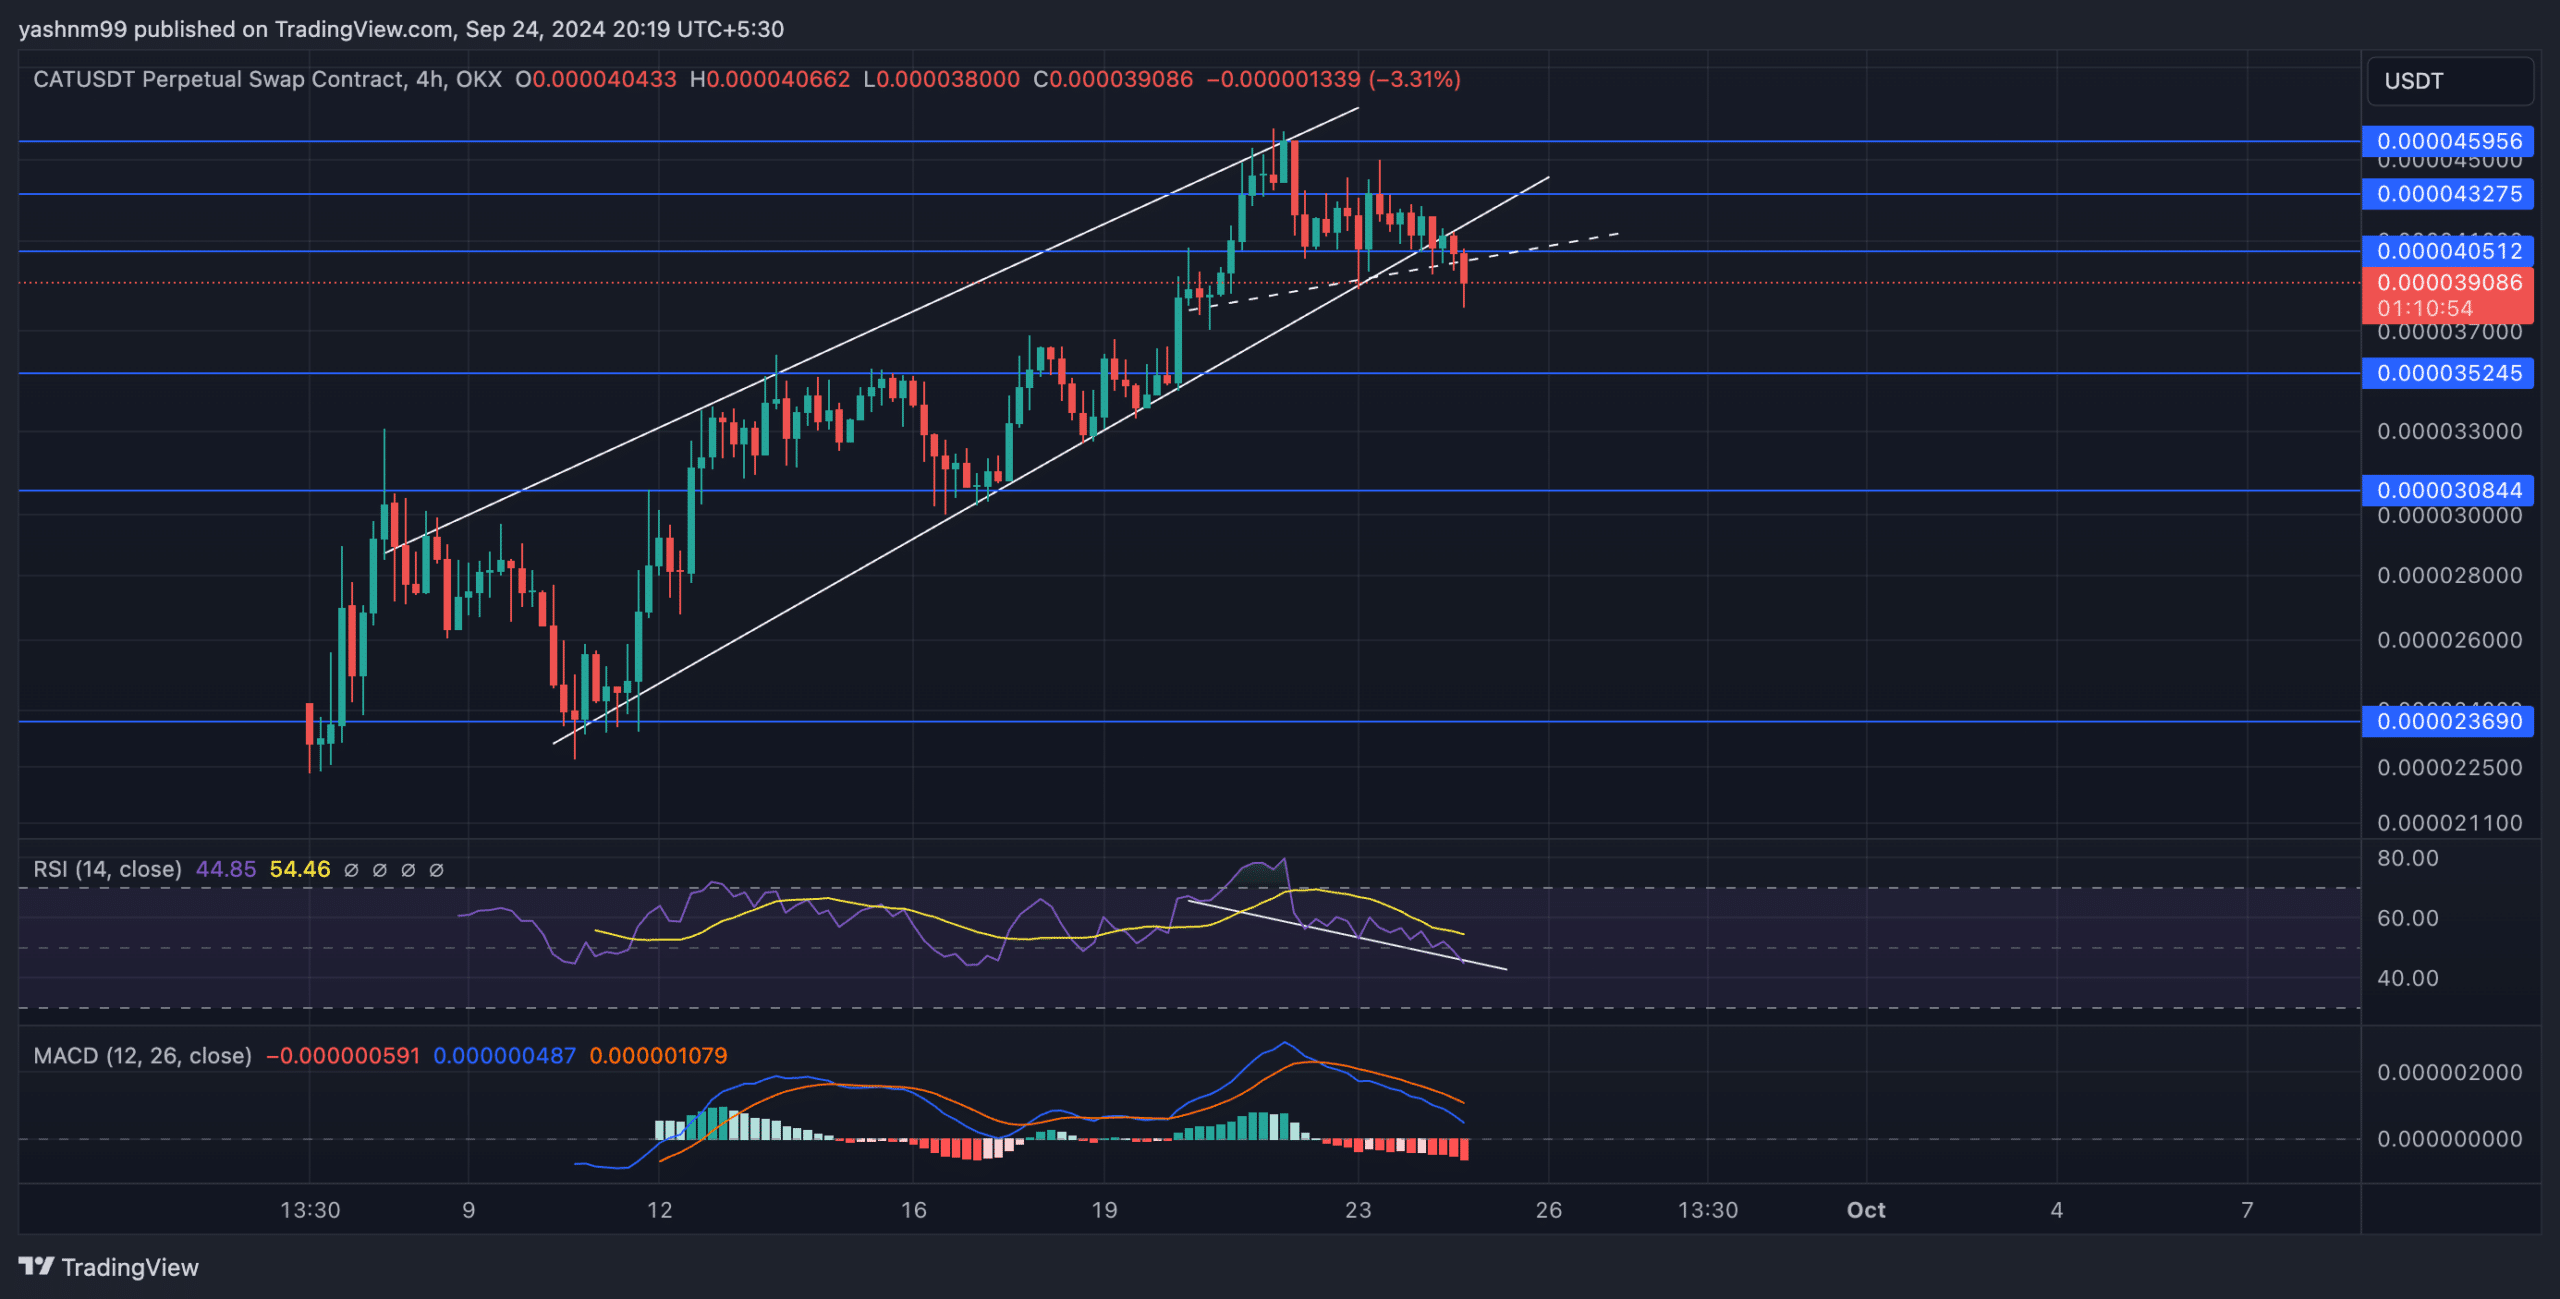
Simon’s Cat [CAT] recently entered a price discovery phase, hitting a new all-time high of $0.0000464 on September 21st. The meme coin experienced a significant rally but has since slowed down after breaking out of a rising wedge pattern.
As of the latest update, CAT is trading at $0.0000391, showing a decrease of approximately 6.5% in the last 24 hours following a bearish breakout.
Simon’s Cat price forecast: Can RSI fuel a short-term rally?
Similar to many meme coins, CAT witnessed a rally soon after its launch fueled by investor enthusiasm. This excitement led to the meme coin doubling in value in just over two weeks.
Despite the recent slowdown, CAT’s Relative Strength Index (RSI) is showing early signs of a bullish divergence. While the price reached higher highs, the RSI reached lower lows.
This divergence often indicates a potential shift in momentum, potentially offering buyers a short-term rally before another downward movement.
If the bullish divergence materializes, CAT could rebound towards the $0.000041 resistance level and potentially reach its all-time high levels in the upcoming sessions.


Source: TradingView, CAT/USDT
Conversely, the recent breakout from the rising wedge pattern increases the likelihood of a further decline. If selling pressure persists, CAT may find support at $0.0000352 and $0.0000308 before attempting a recovery.
The RSI is hovering around 45, significantly lower than its moving average line, indicating a shift towards selling momentum.
The MACD indicator has experienced a bearish crossover, with the MACD line dropping below the signal line. This crossover typically marks the beginning of a short-term bearish trend. A further decline below the zero level by these lines would confirm a more pronounced downtrend.
Looking ahead
Simon’s Cat (CAT) is at a critical juncture following its all-time high and subsequent pullback from the rising wedge breakout. While the RSI’s bullish divergence hints at a potential short-term rally, traders should exercise caution as technical indicators like the MACD indicate weakening momentum.
A break above $0.0000405 could revive bullish sentiment, pushing the price towards $0.0000464, while a continued decline could test support levels at $0.0000352 and $0.0000308.
Traders are advised to closely monitor these key levels and overall market sentiment to capitalize on CAT’s future movements.

