- There has been a recent shift in the daily market structure.
- If SUI fails to reclaim $1, the retracement phase could last for a few weeks.
An analysis of Sui [SUI] indicated bullish short-term signals, suggesting a potential 9% upward movement. The network’s Total Value Locked (TVL) surpassed $600 million, boosting investor confidence.
Users of the network are likely to be excited about the fast transaction speed. The increasing prices reflect a growing belief in the token. However, long-term holders may encounter some obstacles.
A break in the bearish structure hints at a partial retracement


Source: SUI/USDT on TradingView
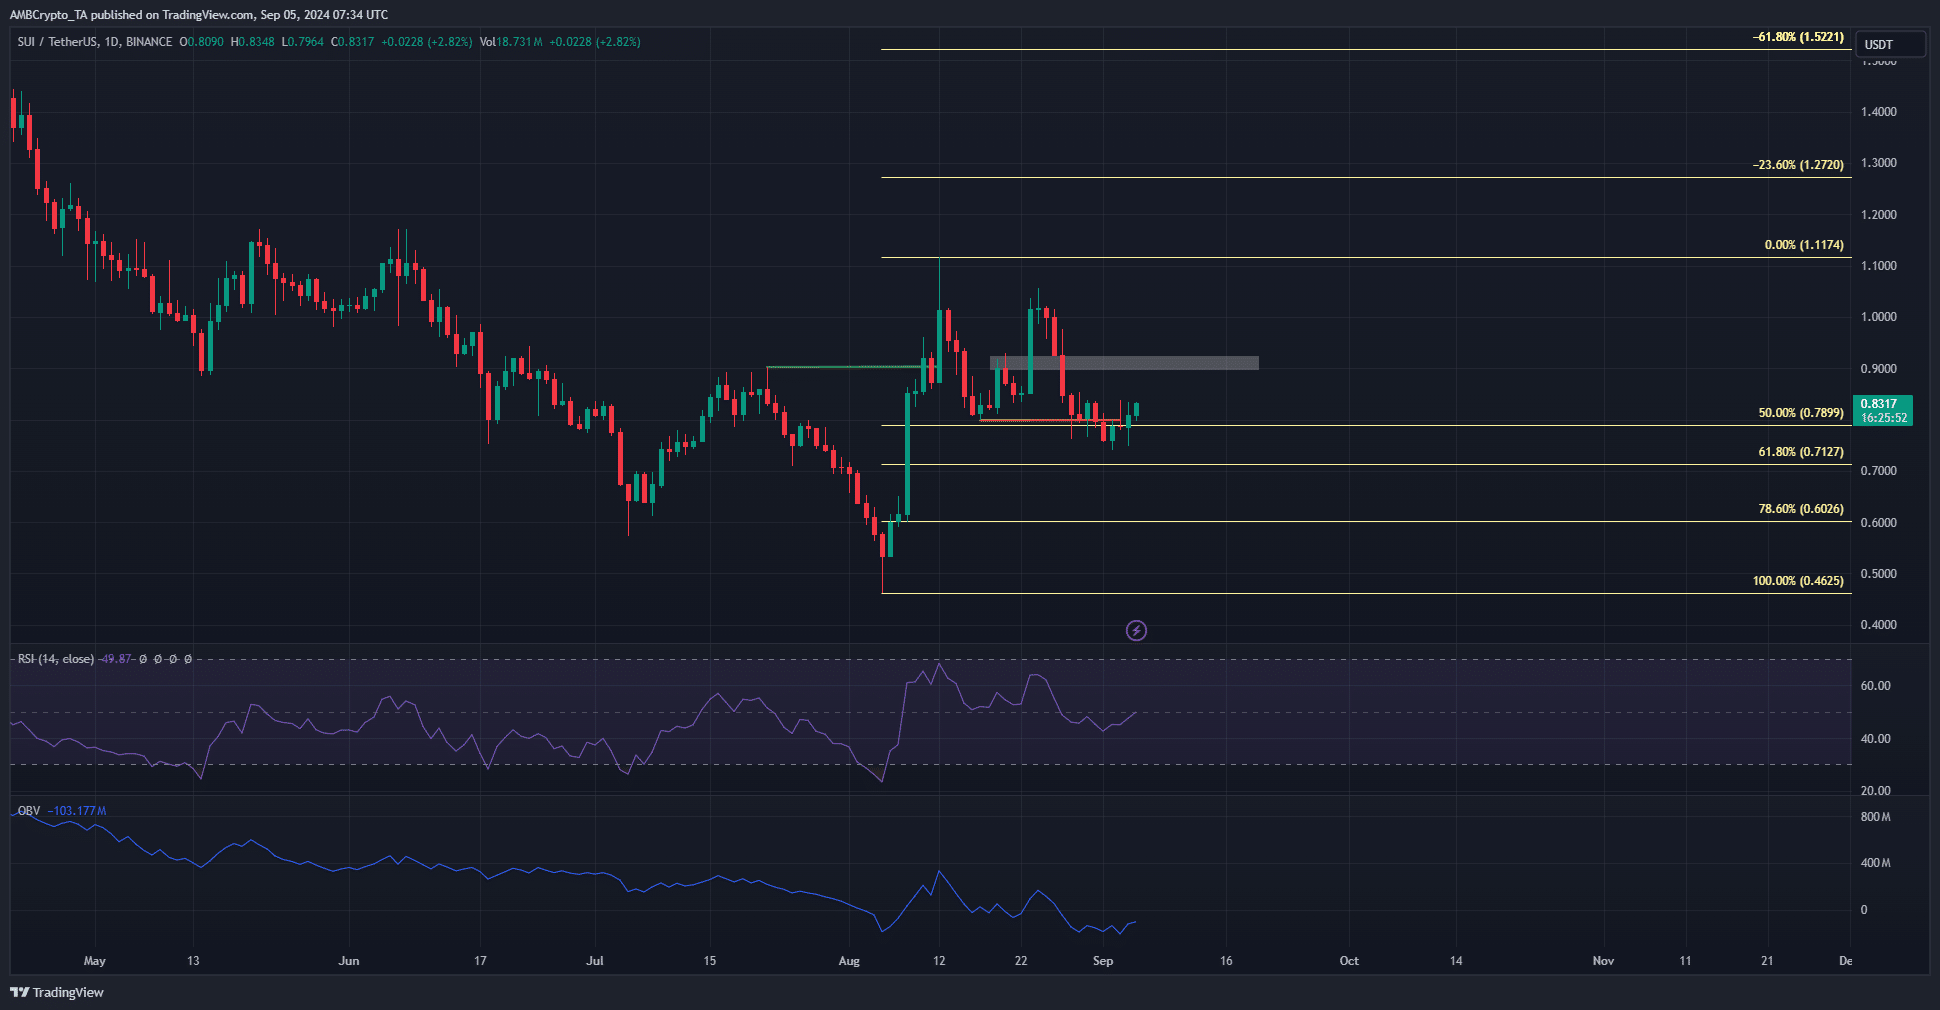
On August 10th, the daily chart’s market structure turned bullish as SUI surpassed $0.902, reaching $1.11 and almost retesting the May resistance zone. Subsequently, the token experienced some retracement.
The market structure shifted bearishly on August 31st, indicating a potential retracement phase. The $0.9-$0.93 range is a short-term target before further declines.
The daily RSI stood at 49.9, showing neutral momentum. It turned bearish during the market structure break. Additionally, the OBV did not sustain the highs seen in August.
This suggests that traders lacked confidence in a prolonged rally. The Fibonacci retracement levels at $0.6 and $0.712 are the next key levels to watch.
An increase in spot CVD supports a potential price rebound
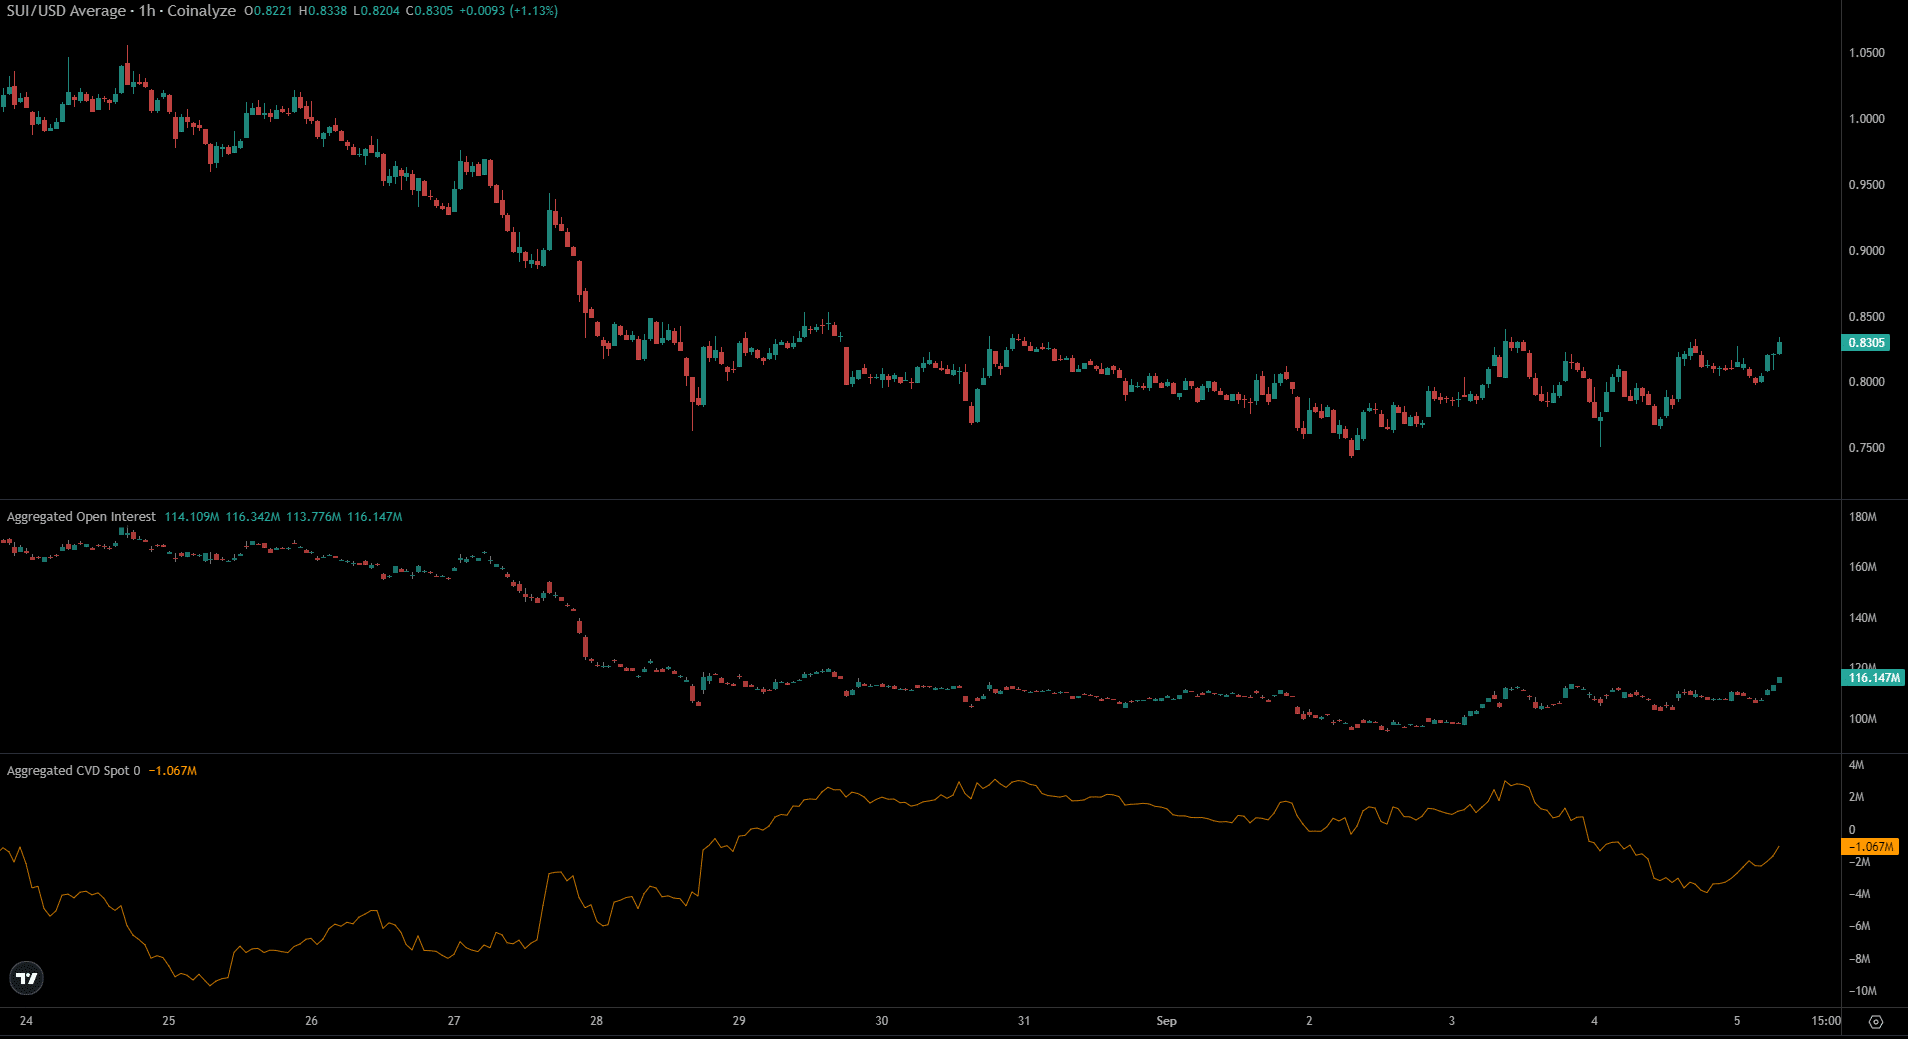
Over the last two days, the price rebound from $0.75 to $0.83 coincided with a nearly $20 million increase in Open Interest.
Is your portfolio in the green? Use the Sui Profit Calculator
This indicates that traders were willing to go long on SUI, anticipating profits.
In the past 24 hours, the spot CVD started to rise, suggesting a potential bounce to the $0.9 local resistance zone. Whether bulls will face resistance there remains to be seen.
Disclaimer: The information provided is the writer’s opinion and does not constitute financial, investment, trading, or other advice.


