America has a fascination with counting its billionaires and keeping track of the S&P’s every move. However, the millions of people struggling to pay rent or put food on the table often go unnoticed.
Poverty is like an invisible cloak that covers every corner of the country, yet it is often overlooked in a society that values success based on financial worth.
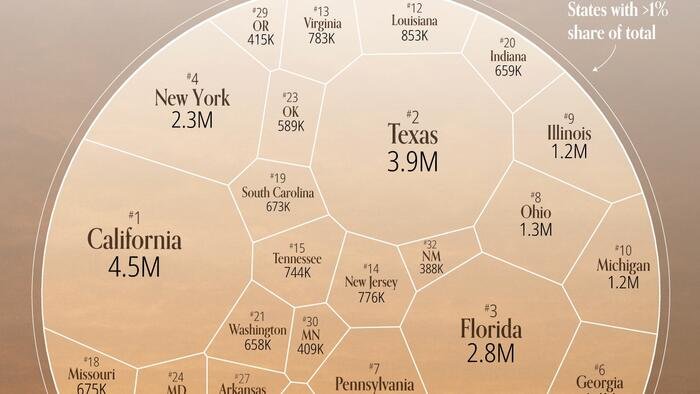
Visual Capitalist’s Pallavi Rao breaks down where the poor reside in America, ranking each state based on poverty levels.
Data for this visualization is sourced from the U.S. Census Bureau.
The data averages three years of Current Population Survey results (2021-2023) to estimate the number of residents in each state living below the federal poverty line.
Refer to the last section for more details on their methodology.
Ranked: U.S. States by Residents in Poverty
Four populous states—California, Texas, Florida, and New York—account for 13.5 million low-income residents, representing over a third of all Americans living in poverty.
California alone has 4.5 million individuals struggling to make ends meet, roughly equivalent to the population of metropolitan Phoenix.
| Rank | State | # in Poverty (Thousands, Sortable) |
# in Poverty (Readable) |
Share of All Americans in Poverty |
|---|---|---|---|---|
| 1 | California | 4,521 | 4.5M | 12.0 |
| 2 | Texas | 3,910 | 3.9M | 10.4 |
| 3 | Florida | 2,782 | 2.8M | 7.4 |
| 4 | New York | 2,349 | 2.3M | 6.2 |
| 5 | North Carolina | 1,416 | 1.4M | 3.8 |
| 6 | Georgia | 1,400 | 1.4M | 3.7 |
| 7 | Pennsylvania | 1,351 | 1.4M | 3.6 |
| 8 | Ohio | 1,272 | 1.3M | 3.4 |
| 9 | Illinois | 1,245 | 1.2M | 3.3 |
| 10 | Michigan | 1,186 | 1.2M | 3.2 |
| 11 | Arizona | 903 | 903K | 2.4 |
| 12 | Louisiana | 853 | 853K | 2.3 |
| 13 | Virginia | 783 | 783K | 2.1 |
| 14 | New Jersey | 776 | 776K | 2.1 |
| 15 | Tennessee | 744 | 744K | 2.0 |
| 16 | Alabama | 727 | 727K | 1.9 |
| 17 | Kentucky | 699 | 699K | 1.9 |
| 18 | Missouri | 675 | 675K | 1.8 |
| 19 | South Carolina | 673 | 673K | 1.8 |
| 20 | Indiana | 659 | 659K | 1.8 |
| 21 | Washington | 658 | 658K | 1.7 |
| 22 | Massachusetts | 604 | 604K | 1.6 |
| 23 | Oklahoma | 589 | 589K | 1.6 |
| 24 | Maryland | 524 | 524K | 1.4 |
| 25 | Mississippi | 501 | 501K | 1.3 |
| 26 | Wisconsin | 490 | 490K | 1.3 |
| 27 | Arkansas | 473 | 473K | 1.3 |
| 28 | Colorado | 473 | 473K | 1.3 |
| 29 | Oregon | 415 | 415K | 1.1 |
| 30 | Minnesota | 409 | 409K | 1.1 |
| 31 | Nevada | 409 | 409K | 1.1 |
| 32 | New Mexico | 388 | 388K | 1.0 |
| 33 | Connecticut | 318 | 318K | 0.8 |
| 34 | Iowa | 287 | 287K | 0.8 |
| 35 | West Virginia | 268 | 268K | 0.7 |
| 36 | Kansas | 255 | 255K | 0.7 |
| 37 | Utah | 226 | 226K | 0.6 |
| 38 | Idaho | 172 | 172K | 0.5 |
| 39 | Nebraska | 165 | 165K | 0.4 |
| 40 | Hawaii | 133 | 133K | 0.4 |
| 41 | Maine | 120 | 120K | 0.3 |
| 42 | Montana | 109 | 109K | 0.3 |
| 43 | Delaware | 98 | 98K | 0.3 |
| 44 | New Hampshire | 98 | 98K | 0.3 |
| 45 | Rhode Island | 96 | 96K | 0.3 |
| 46 | District of Columbia | 88 | 88K | 0.2 |
| 47 | Alaska | 74 | 74K | 0.2 |
| 48 | South Dakota | 74 | 74K | 0.2 |
| 49 | North Dakota | 72 | 72K | 0.2 |
| 50 | Vermont | 49 | 49K | 0.1 |
| 51 | Wyoming | 49 | 49K | 0.1 |
| N/A | America Poor
Add A Comment
|

