
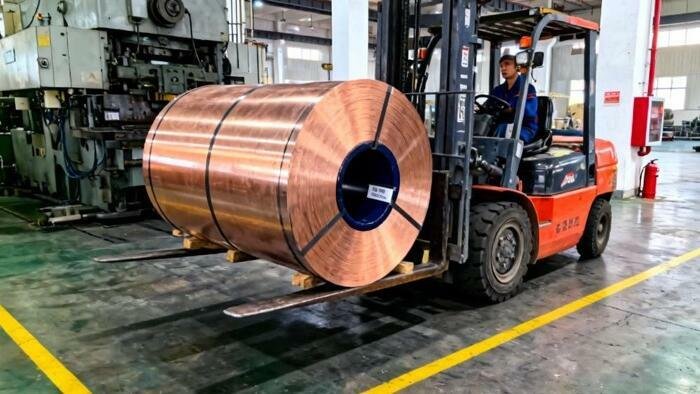
London’s copper futures are on the rise again, nearing record highs as US buyers are purchasing record amounts from the seaborne market, with imports hitting 200,000 tons in July. The potential implementation of phased US tariffs is expected to prolong this buying spree, further tightening the ex-US market and preventing any immediate price correction in London trading.
Rafael Barcellos, the head of Latin American Metals & Mining and Pulp & Paper Equity Research at Bradesco BBI, highlighted in a recent note that there is a deterioration in global mine supply. He pointed out that severe weather conditions in Chile have led Antofagasta and Lundin to reduce their production guidance, exacerbating the existing strain on the physical market.
Barcellos stated:
The month of August saw copper prices continuing their rally from July, surpassing US$14,000/t and reaching approximately US$14,450/t by August 30. The current momentum is driven by short-term physical tightness, as refined copper is being directed to the US in anticipation of potential import tariffs.
While the general consensus views the tariff decision as having a binary impact on copper prices—positive if implemented and negative if not—we believe that both outcomes could ultimately have a bearish effect. The uncertainty surrounding the tariffs is fueling the current upward trend. If tariffs are not put into effect, the excess US inventories would flow elsewhere, increasing global supply. However, if the US proceeds with tariffs, buyers may reduce near-term purchasing, leading to reduced regional demand and easing tightness in other markets. A phased tariff implementation over the coming years, which we consider the most likely scenario, would likely keep US buyers engaged in the seaborne market for an extended period, moderating the demand adjustment and limiting potential price declines in the short term.
On the supply side, the concentrate market remains tight, worsened by extreme weather in Chile. Antofagasta and Lundin Mining had to revise their 2026 production guidance downwards due to disruptions at Los Pelambres and Caserones. In response to persistent concentrate tightness, Chinese smelters are increasingly turning to secondary feedstock, with a 15% year-over-year increase in copper scrap imports in July (9% year-to-date).
A recent Bloomberg report highlighted data from the International Copper Study Group, indicating a 1.1% decline in global mine production in the first half of 2026, with major players like Codelco and Freeport-McMoRan experiencing double-digit output reductions.

In a shift from their initial forecast of supply growth, Morgan Stanley now anticipates mine production to remain stable or slightly lower by the end of the year, potentially marking the first annual decline since 2017.
Jefferies data, cited by SP Angel, indicates that producers representing around two-thirds of global supply recorded a 3.5% decline in the first half and a 4.1% drop in the second quarter. Chile, the world’s largest copper producer, had its weakest second quarter in almost twenty years and is projected to see a 2.6% decrease in annual output.
Additional Notes:
Copper prices have been steadily rising for ten consecutive weeks on the London Metal Exchange.

In conclusion, the current situation indicates a structurally bullish period for copper. The increasing demand from electric vehicles, expanding power grids, and growing data centers for artificial intelligence is coinciding with tightness in the physical market, leading to higher prices in London.