

It appears that Dogecoin is currently undervalued based on on-chain data analysis, despite experiencing a significant downturn over the past year. However, recent data from Alphractal indicates that the recent price increase is driven more by leveraged speculation rather than an increase in network demand.
Even though DOGE has seen a 10.8% increase in the last 30 days, it is still down 42.75% year-over-year and trades 22.27% below its 200-day moving average. This leaves the overall trend fragile, despite some short-term momentum improvements.
Dogecoin’s On-Chain Valuation Indicates Capitulation
One of the most bullish indicators for Dogecoin is its valuation metrics. Alphractal AI’s analysis shows that DOGE’s MVRV ratio is at 0.686, meaning its market cap is trading at a 31.4% discount to its realized value. This historically signals accumulation zones, where long-term buyers start reassessing risk-reward.
The NUPL reading also supports this, with Dogecoin still in capitulation territory at -0.459. The average holder is still underwater, with most DOGE holders acquiring their coins at higher prices than the current level.
Traders Are Turning Bullish
While spot-market weakness persists, derivatives positioning has become notably bullish. Open interest has increased by 15.73% in the last week to $1.02 billion, representing 6.05% of Dogecoin’s market capitalization. The long/short ratio is at 2.057, indicating a strong bullish sentiment among leveraged traders.
Despite the positive outlook from traders, the report highlights a decline in daily active addresses and transactions, indicating a divergence between market positioning and actual network use. This suggests that the recent price increase may be driven more by leveraged speculation rather than organic adoption.
Exchange balances have also risen, indicating more available supply for sale. This, combined with weakening on-chain demand, poses a risk to Dogecoin’s price stability.
At the time of writing, DOGE is trading at $0.09922.
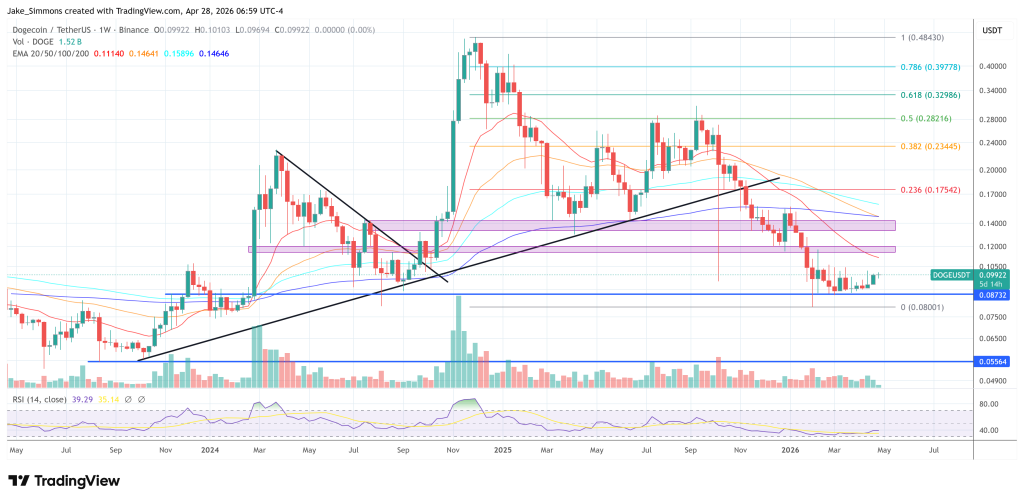
Featured image created with DALL.E, chart from TradingView.com