

Authored by Dana Anderson via Redfin News,
Currently, there is a staggering $698 billion worth of homes listed for sale in the United States, which is a 20.3% increase from last year and the highest dollar amount ever recorded.
This data is based on an analysis of listings on Redfin.com dating back to 2012. The total dollar value of all inventory on the market is calculated by summing up the list price of all active listings in the U.S. as of the last day of each month, with the most recent data available being from April 2025. In this report, the term “value” is used interchangeably with “list price,” meaning the total home value is the sum of all list prices. Stale inventory refers to home listings that have been on the market for at least 60 days and are still actively listed for sale at the end of the relevant month. For a detailed explanation of the methodology, please refer to the end of the report.
The total value of U.S. home listings has reached a record high due to the combination of increasing inventory, declining demand, and rising home sale prices:
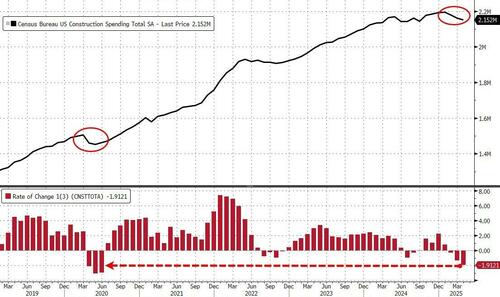
- Housing supply has hit a 5-year peak. The market currently has significantly more sellers than buyers. The total number of homes for sale nationwide increased by 16.7% year over year in April, reaching the highest level in 5 years. This surge can be attributed to the easing of mortgage rate lock-ins and homeowners looking to capitalize on economic uncertainty by selling. New listings also saw an 8.6% increase, reaching a 3-year high.
- Homes are spending more time on the market. The average time for a home to sell in April was 40 days, which is 5 days longer than the previous year. There is also a growing portion of inventory that has been listed for over two months, as detailed in the subsequent section of this report.
- Demand from homebuyers is decreasing. Home sales are on a decline, with Redfin agents in many regions reporting that potential buyers are pulling back due to the record-high monthly housing expenses and widespread economic instability.
- Home prices are on the rise. The median home-sale price in the U.S. experienced a 1.4% year-over-year increase in April. It is worth noting that while the total value of inventory has increased by 20.3% year over year, indicating a higher number of listings, rising prices have not been the primary driver of this growth in recent years.
Another Redfin analysis revealed that there are nearly half a million more home sellers than buyers in the current housing market. The surplus of homes listed without a proportional number of buyers, coupled with continuously escalating prices, has resulted in a significant amount of unsold inventory on the market.
Matt Purdy, a Redfin Premier agent in Denver, commented on the situation: “A large wave of listings entered the market at the beginning of spring, but there weren’t enough buyers to absorb them. Potential homebuyers are only making purchases out of necessity, and even serious buyers are now backing out of deals more frequently than before. Buyers are in a position to negotiate; there is still an excess of inventory available, and sellers are acknowledging this reality by being willing to negotiate lower prices.”
Comparing the current total inventory value to the hot housing market during the pandemic, characterized by low supply, reveals a stark contrast. In January 2022, the total value of listings plummeted to $309 billion, the lowest on record since 2012. At the beginning of 2022, mortgage rates were at a near-record low of 3.1%, demand from homebuyers was robust, and housing supply was at its scarcest level on record. Homes were selling rapidly within 24 days, in sharp contrast to the current average of 40 days.
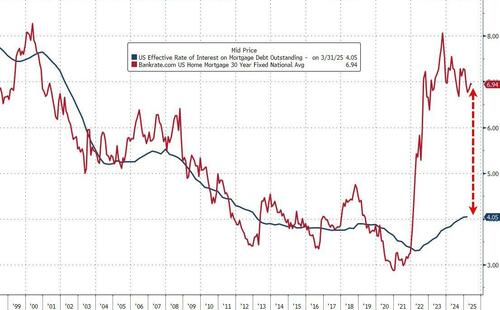
Furthermore, let’s examine the disparity between current mortgage rates and the average effective rate for all homeowners…
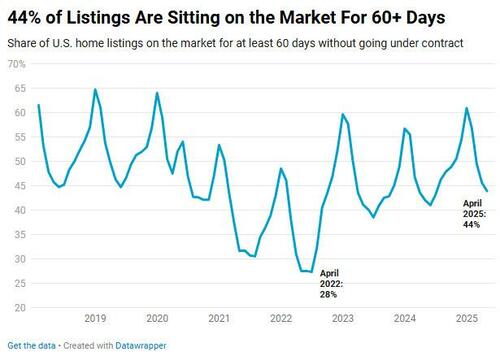
44% of Listings Have Been Lingering on the Market For 60+ Days
In April, over 44% of listings had been on the market for 60 days or more without going under contract, categorized in this report as “stale inventory.” This figure marks an increase from 42.1% the previous year and represents the highest April percentage since 2020, when the pandemic caused the housing market to stagnate.
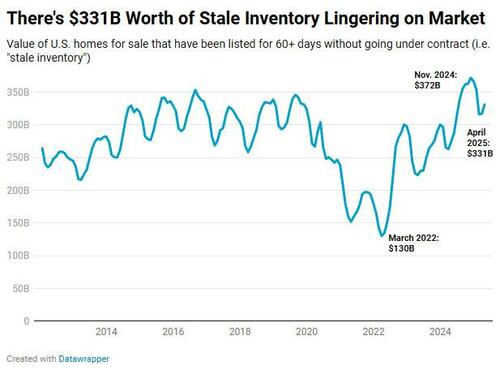
There’s $331 Billion Worth of Stale Inventory on the Market
The total value of stale inventory amounts to $331 billion, representing nearly half of the overall dollar value of all inventory. This figure has escalated by 20.5% year over year.
Redfin’s Head of Economics Research, Chen Zhao, commented on the record-high dollar value of homes listed for sale, stating that the current market favors buyers due to the surplus of homes for sale, the increased value of these homes, and the prevalence of unsold inventory. It is projected that rising inventory, diminished demand, and the abundance of stale supply will contribute to a 1% drop in home prices by the end of this year, ultimately improving affordability for buyers as incomes continue to rise.
500,000 More Sellers than Buyers?!
Recent data from Redfin indicates that there are 34% more sellers than buyers in the current market.
There are approximately 1.9 million home sellers in the U.S. housing market compared to an estimated 1.5 million homebuyers, resulting in 33.7% more sellers than buyers. This substantial surplus of sellers, totaling nearly 490,041 individuals, is unprecedented in records dating back to 2013. A year ago, sellers outnumbered buyers by just 6.5%, while two years ago, it was the buyers who held the majority.
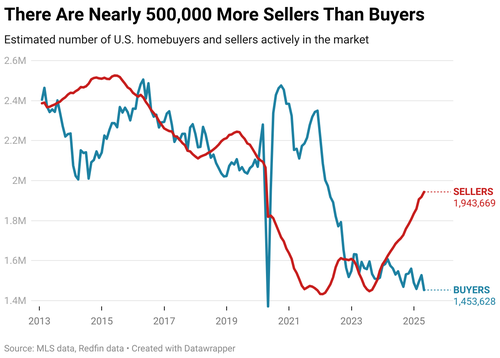
Not since March 2020 have there been this many home sellers in the market, nor have buyers been this scarce since April 2020, when the onset of the pandemic severely impacted the housing market.
The analysis conducted in April 2025 indicates that the number of sellers in the market corresponds to the active listings in the MLS. To estimate the number of buyers, a model was created using data on pending sales and the average duration from a buyer’s initial tour to their purchase. Detailed methodology and data for the 50 most populous metropolitan areas can be found below.
Redfin recently predicted a 1% year-over-year decrease in home prices by the end of 2025, citing the growing disparity between buyers and sellers as the primary factor. When sellers outnumber buyers significantly, it signifies a buyer’s market, where buyers have more leverage in negotiations, potentially leading to price reductions.
Sellers Outnumber Buyers for Multiple Reasons:
- High costs of homeownership: Escalating home prices and mortgage rates are deterring potential buyers. The median home sale price rose by 1.6% year over year to $431,931 in April, marking the slowest growth in nearly two years. Despite this, monthly housing payments reached a record high due to the enduring high mortgage rates and prices. In April, the average 30-year-fixed mortgage rate stood at 6.73%, more than double the record low recorded during the pandemic.
- Economic uncertainty: Factors such as tariff negotiations, job cuts, and changes in federal policies are contributing to the dampened demand from homebuyers. A recent survey conducted by Redfin revealed that nearly 25% of Americans are postponing major purchases due to tariffs.
- Reduction in the mortgage rate lock-in effect: Homeowners who secured ultra-low mortgage rates during the pandemic are now relinquishing those rates and opting to sell their homes. Life changes such as job transitions, return-to-office mandates, and divorces necessitate moves for many individuals. The idea of accepting a higher mortgage rate no longer shocks as it did when rates skyrocketed in 2022.
Asad Khan, Redfin’s Senior Economist, emphasized the changing dynamics in the housing market, stating, “The shift in the housing market’s power balance favors buyers, but many sellers have yet to acknowledge this reality. Several are still hopeful that their property will fetch top dollar. However, as homes linger longer on the market with dwindling buyer interest, more sellers will come to terms with the adjusted market conditions and revise their expectations accordingly.”
Sellers are gradually recognizing this shift, and they are likely to face further realities during the summer, a period when demand typically wanes. In April, over 44% of home listings had been on the market for 60 days or more, marking the highest April percentage since 2020. The accumulation of stale inventory can be attributed in part to sellers overpricing their homes based on inflated comps from the previous seller’s market, which are no longer reflective of current market conditions. Some sellers are setting high prices to recoup their investment, having purchased their homes at the market’s peak.
Advice for Sellers: Time is not on your side. If you are contemplating selling, it is advisable to act promptly as home prices in your area may decline. For properties that have been listed for over a month without traction, consider enhancing your property or adjusting the price.
Advice for Buyers: Many individuals have been priced out of the housing market, even if prices decrease. However, for those still in the market, do not lose hope. With falling home prices, rising wages, and stable mortgage rates as anticipated, homes that were previously unattainable may become within reach as sellers entertain lower offers and concessions.
Historical Patterns Show Home Prices Cool When Sellers Outnumber Buyers
A shift in the balance between buyers and sellers usually foreshadows changes in home prices. Apart from the initial pandemic onset, the last time sellers significantly outnumbered buyers coincided with the period of rising mortgage rates in 2018.
In November 2018, the average 30-year-fixed mortgage rate peaked at 4.87%, the highest level in nearly eight years and nearly a full percentage point higher than the previous year. The following month saw sellers outnumber buyers by 9.4%, the largest percentage since 2015 and a reversal from the previous year when buyers held the majority. Three months later, home-price growth slowed to the lowest level in at least six years, with prices increasing by 2% year over year to $283,912.
A similar trend occurred in 2013-2014, as demonstrated in the chart below, illustrating that fluctuations in the buyer-to-seller ratio typically precede similar variations in home-price growth.
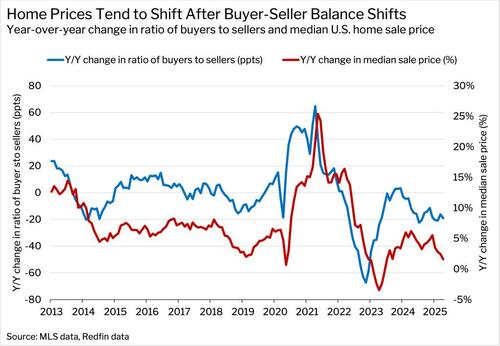
Presently, the imbalance between buyers and sellers is more pronounced, exerting additional pressure on prices. Annual price growth has decelerated to 1.6% from 6.2% last year, with expectations for this trend to persist, ultimately resulting in price declines. The last instance of home prices registering a year-over-year decline was in 2023.
Even as mortgage rates surged in 2022, buyers outnumbered sellers. It was not until November 2023, following a spike in mortgage rates to nearly 8%, that sellers began to surpass buyers. Since then, homebuyer demand has been sluggish, and this trend is anticipated to persist due to prevailing economic uncertainty and concerns about a recession. What has changed recently is the influx of more sellers into the market.
For more insights, continue reading the complete report here…
Loading…