

Bitcoin: Exploring the Impact of Dominant Long Positions
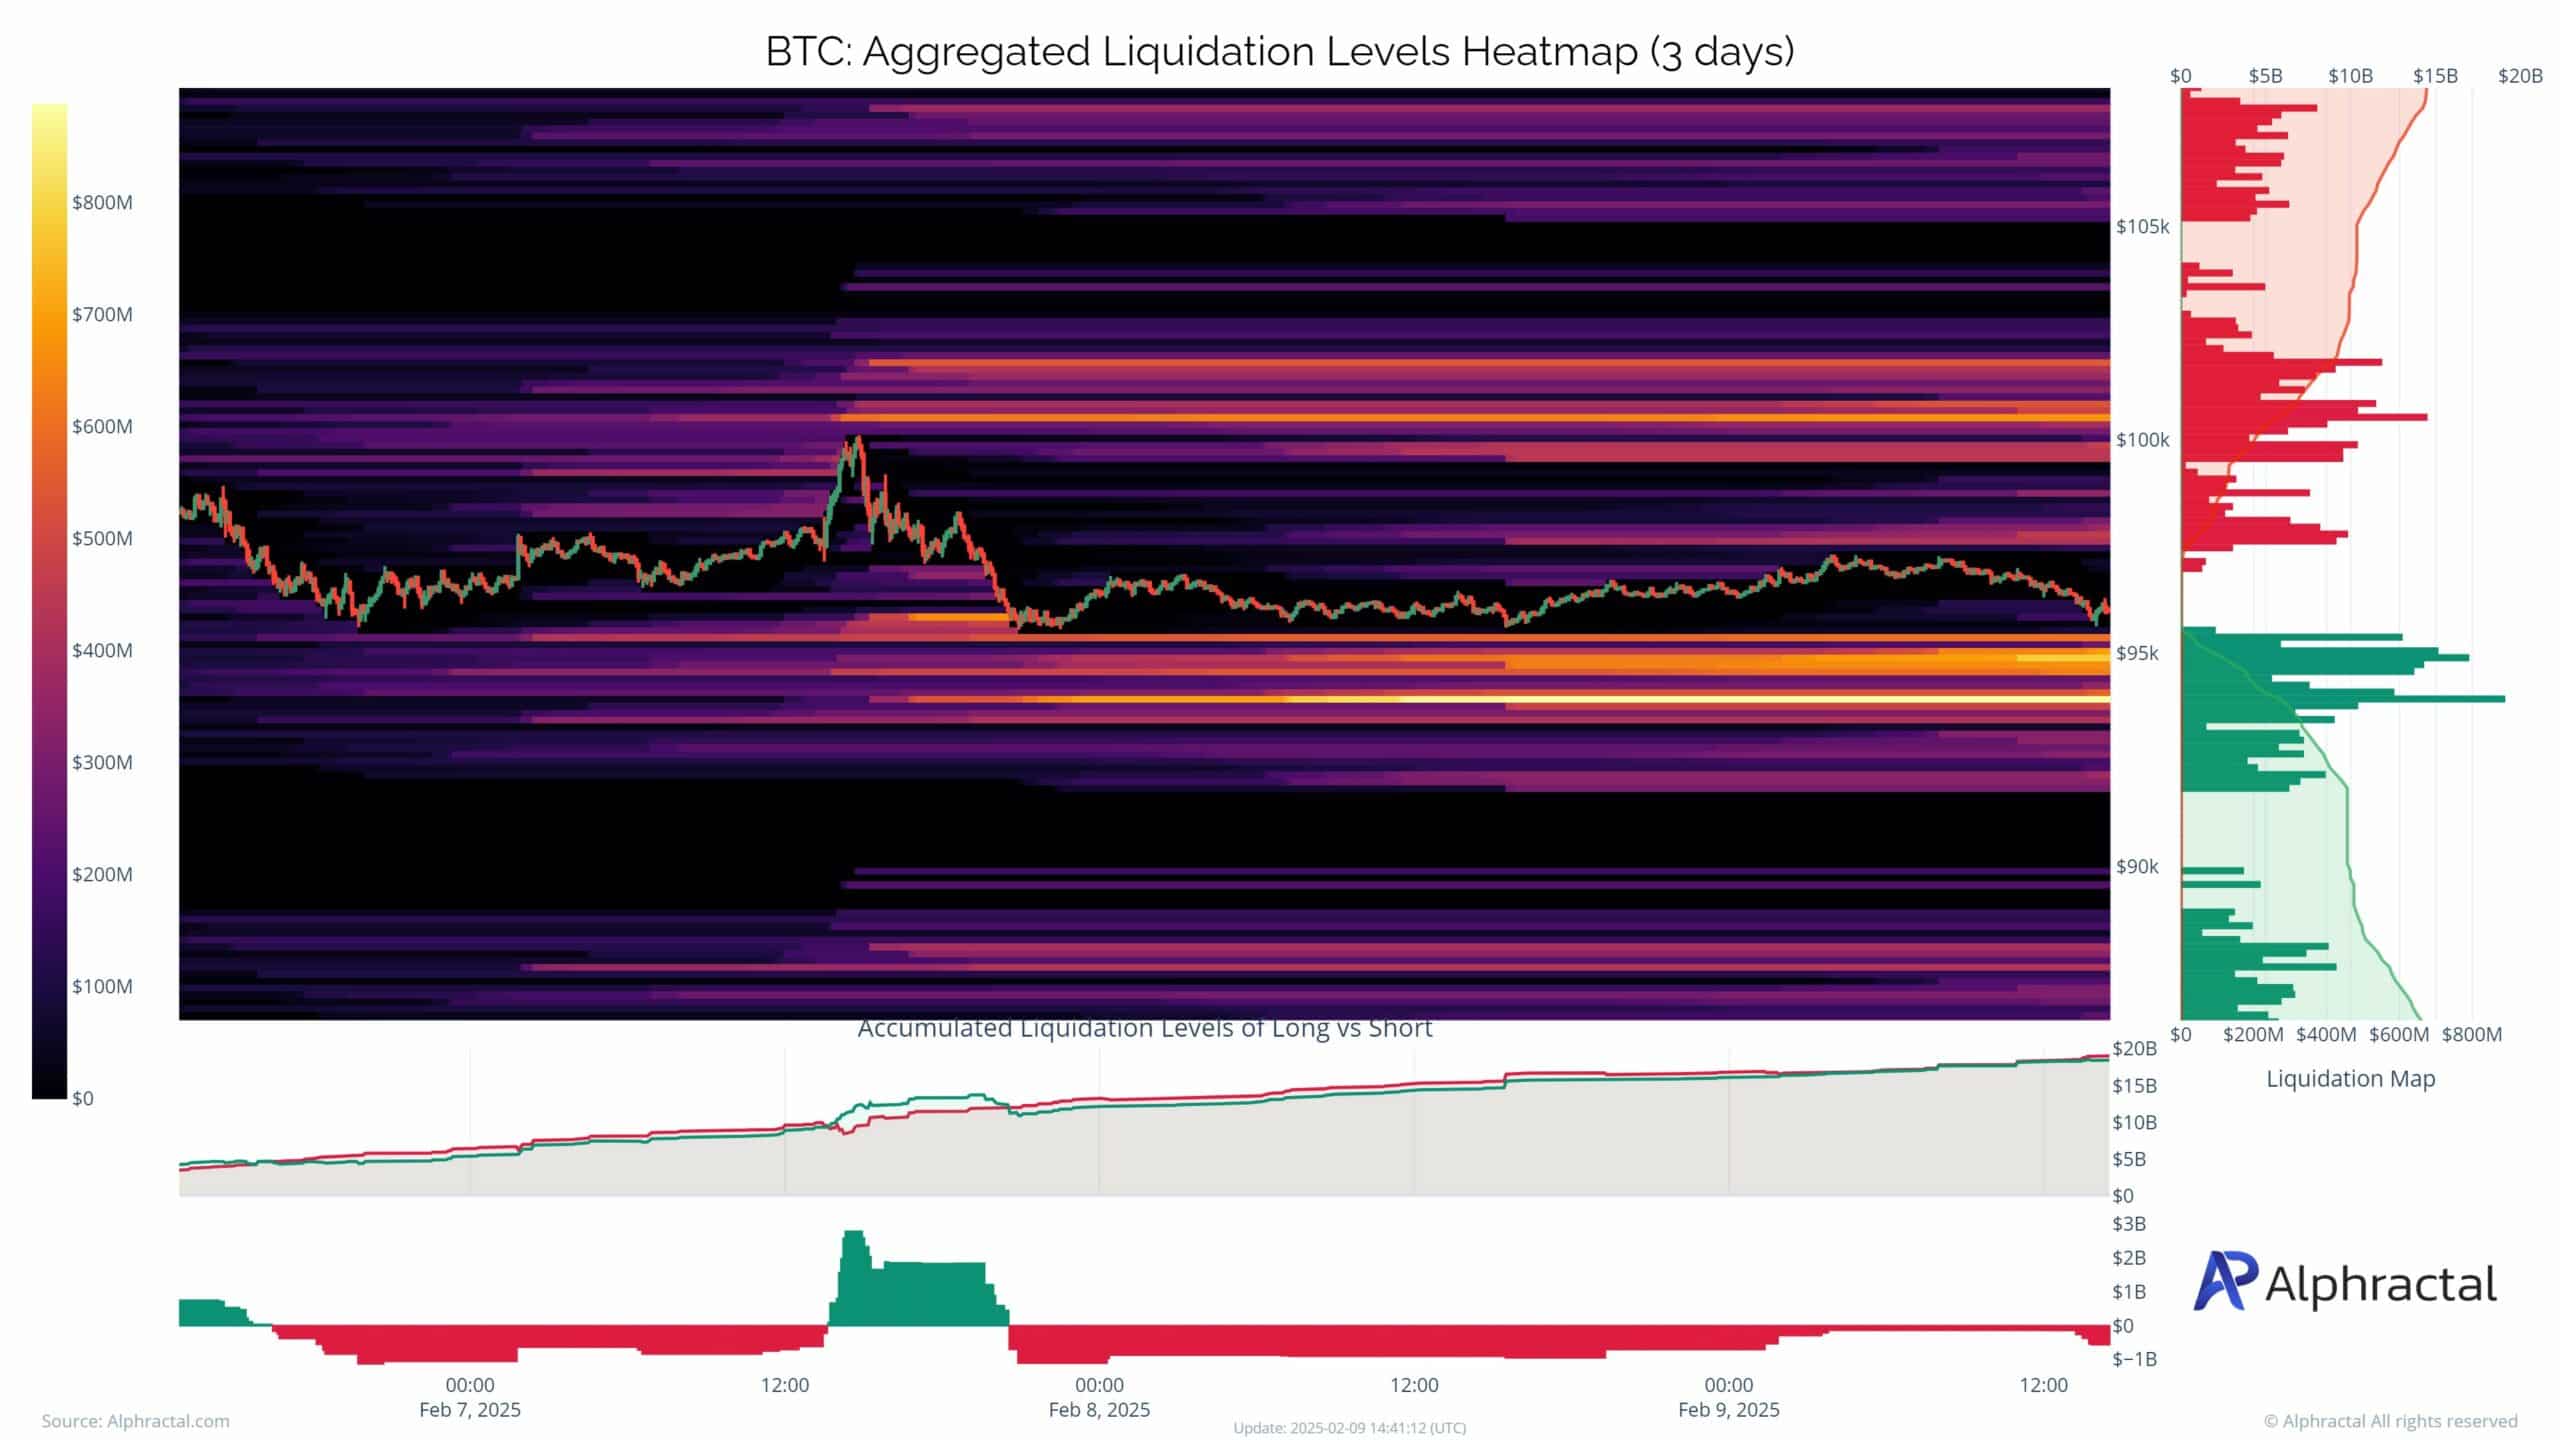
Currently, Bitcoin is trading at around $97k, with a notable resistance level at the psychological mark of $100,000. Despite a bullish outlook, the market is seeing a prevalence of long positions, which could be contributing to the price stagnation.
Source: Alphractal
An analysis of the liquidation heatmap reveals clusters of potential liquidation levels near $100,000 and a build-up around $95,000, indicating areas of potential volatility due to forced liquidations.
The key to sustaining the bullish momentum for Bitcoin lies in breaking the $100,000 resistance level in the short term. Conversely, failing to hold above $95,000 could lead to a downward trend towards $92,000, where further liquidation zones could heighten bearish pressure.
Traders are advised to closely monitor these critical levels to anticipate any shifts in the market dynamics.
ETH Liquidation Zones: Unveiling a Potential Cascade
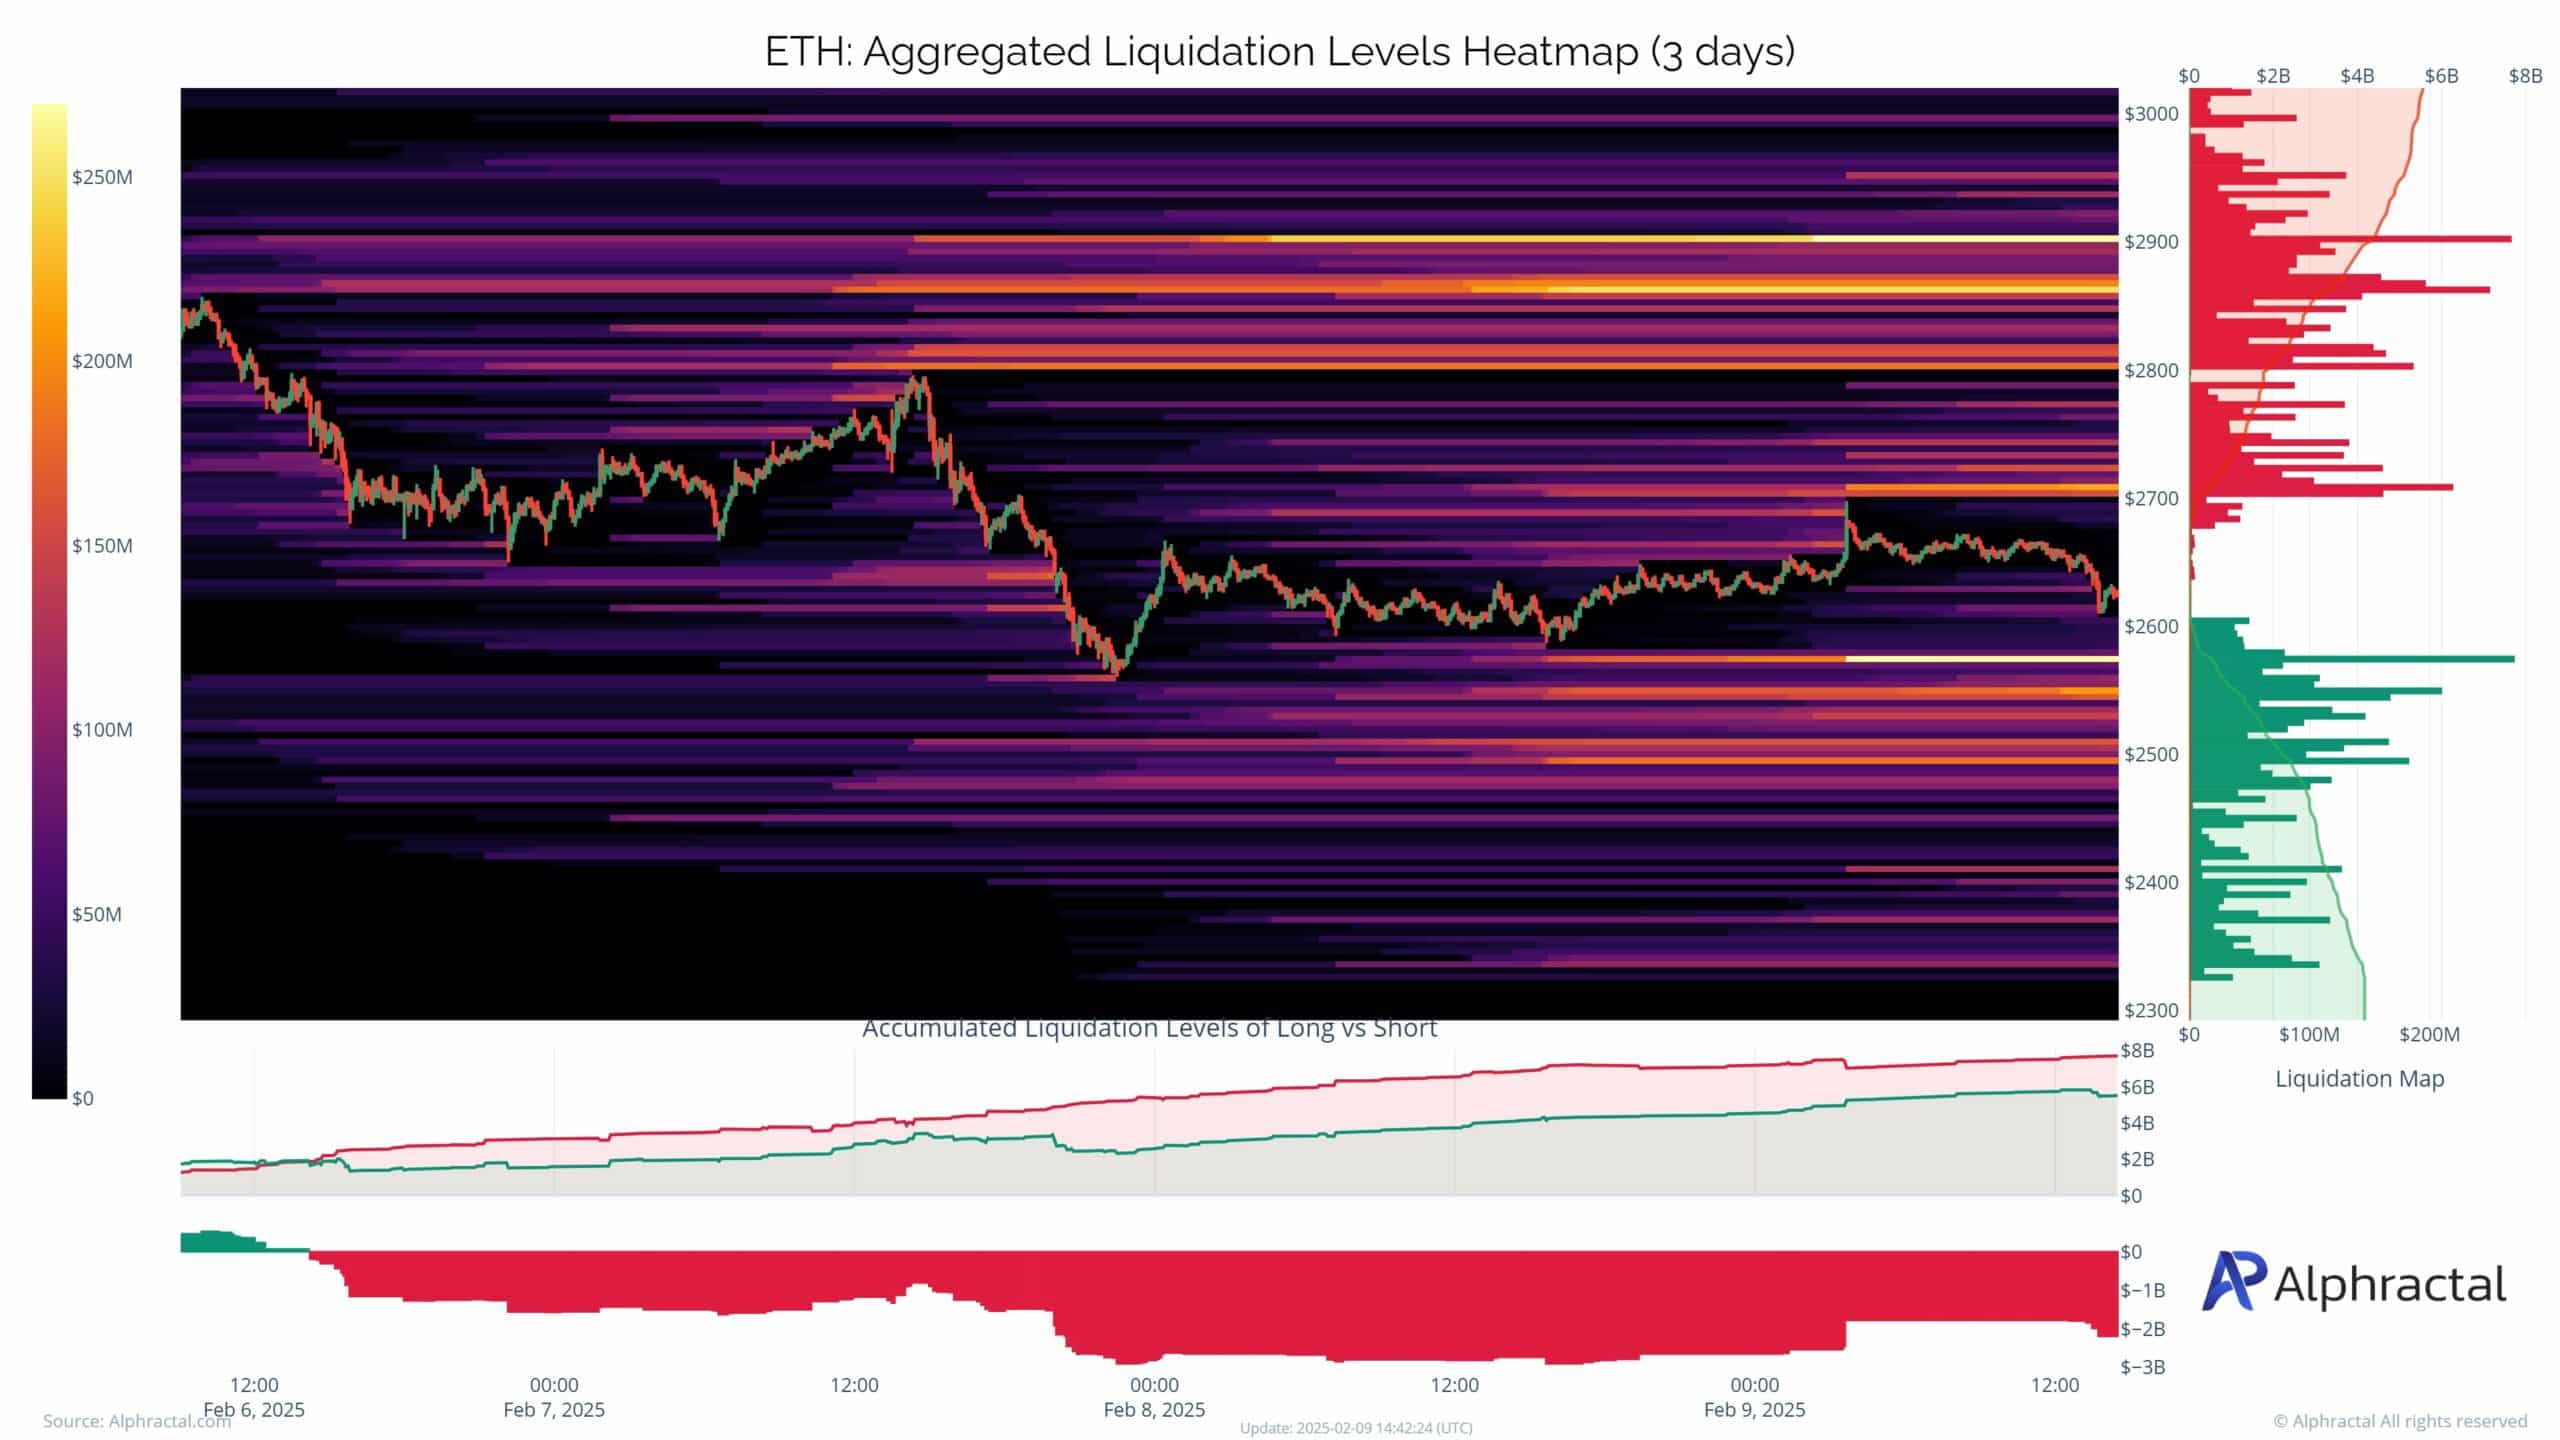
The Ethereum liquidation heatmap displays significant clusters of liquidation levels around $2,700 to $2,800 for long positions and near $2,500 for shorts, indicating vulnerable areas where price movements could trigger a cascade of liquidations.
Source: Alphractal
The liquidity map suggests increasing sell-side pressure as Ethereum nears the $2,700 mark, with notable activity around $2,800. Shorts are concentrated below $2,500, indicating strong support for ETH unless there is a shift in market sentiment.
This scenario sets up a narrow trading band for Ethereum, with liquidations potentially acting as the catalyst for a breakout or breakdown in the price.
BNB: Caught in a Market Standoff
Source: Alphractal
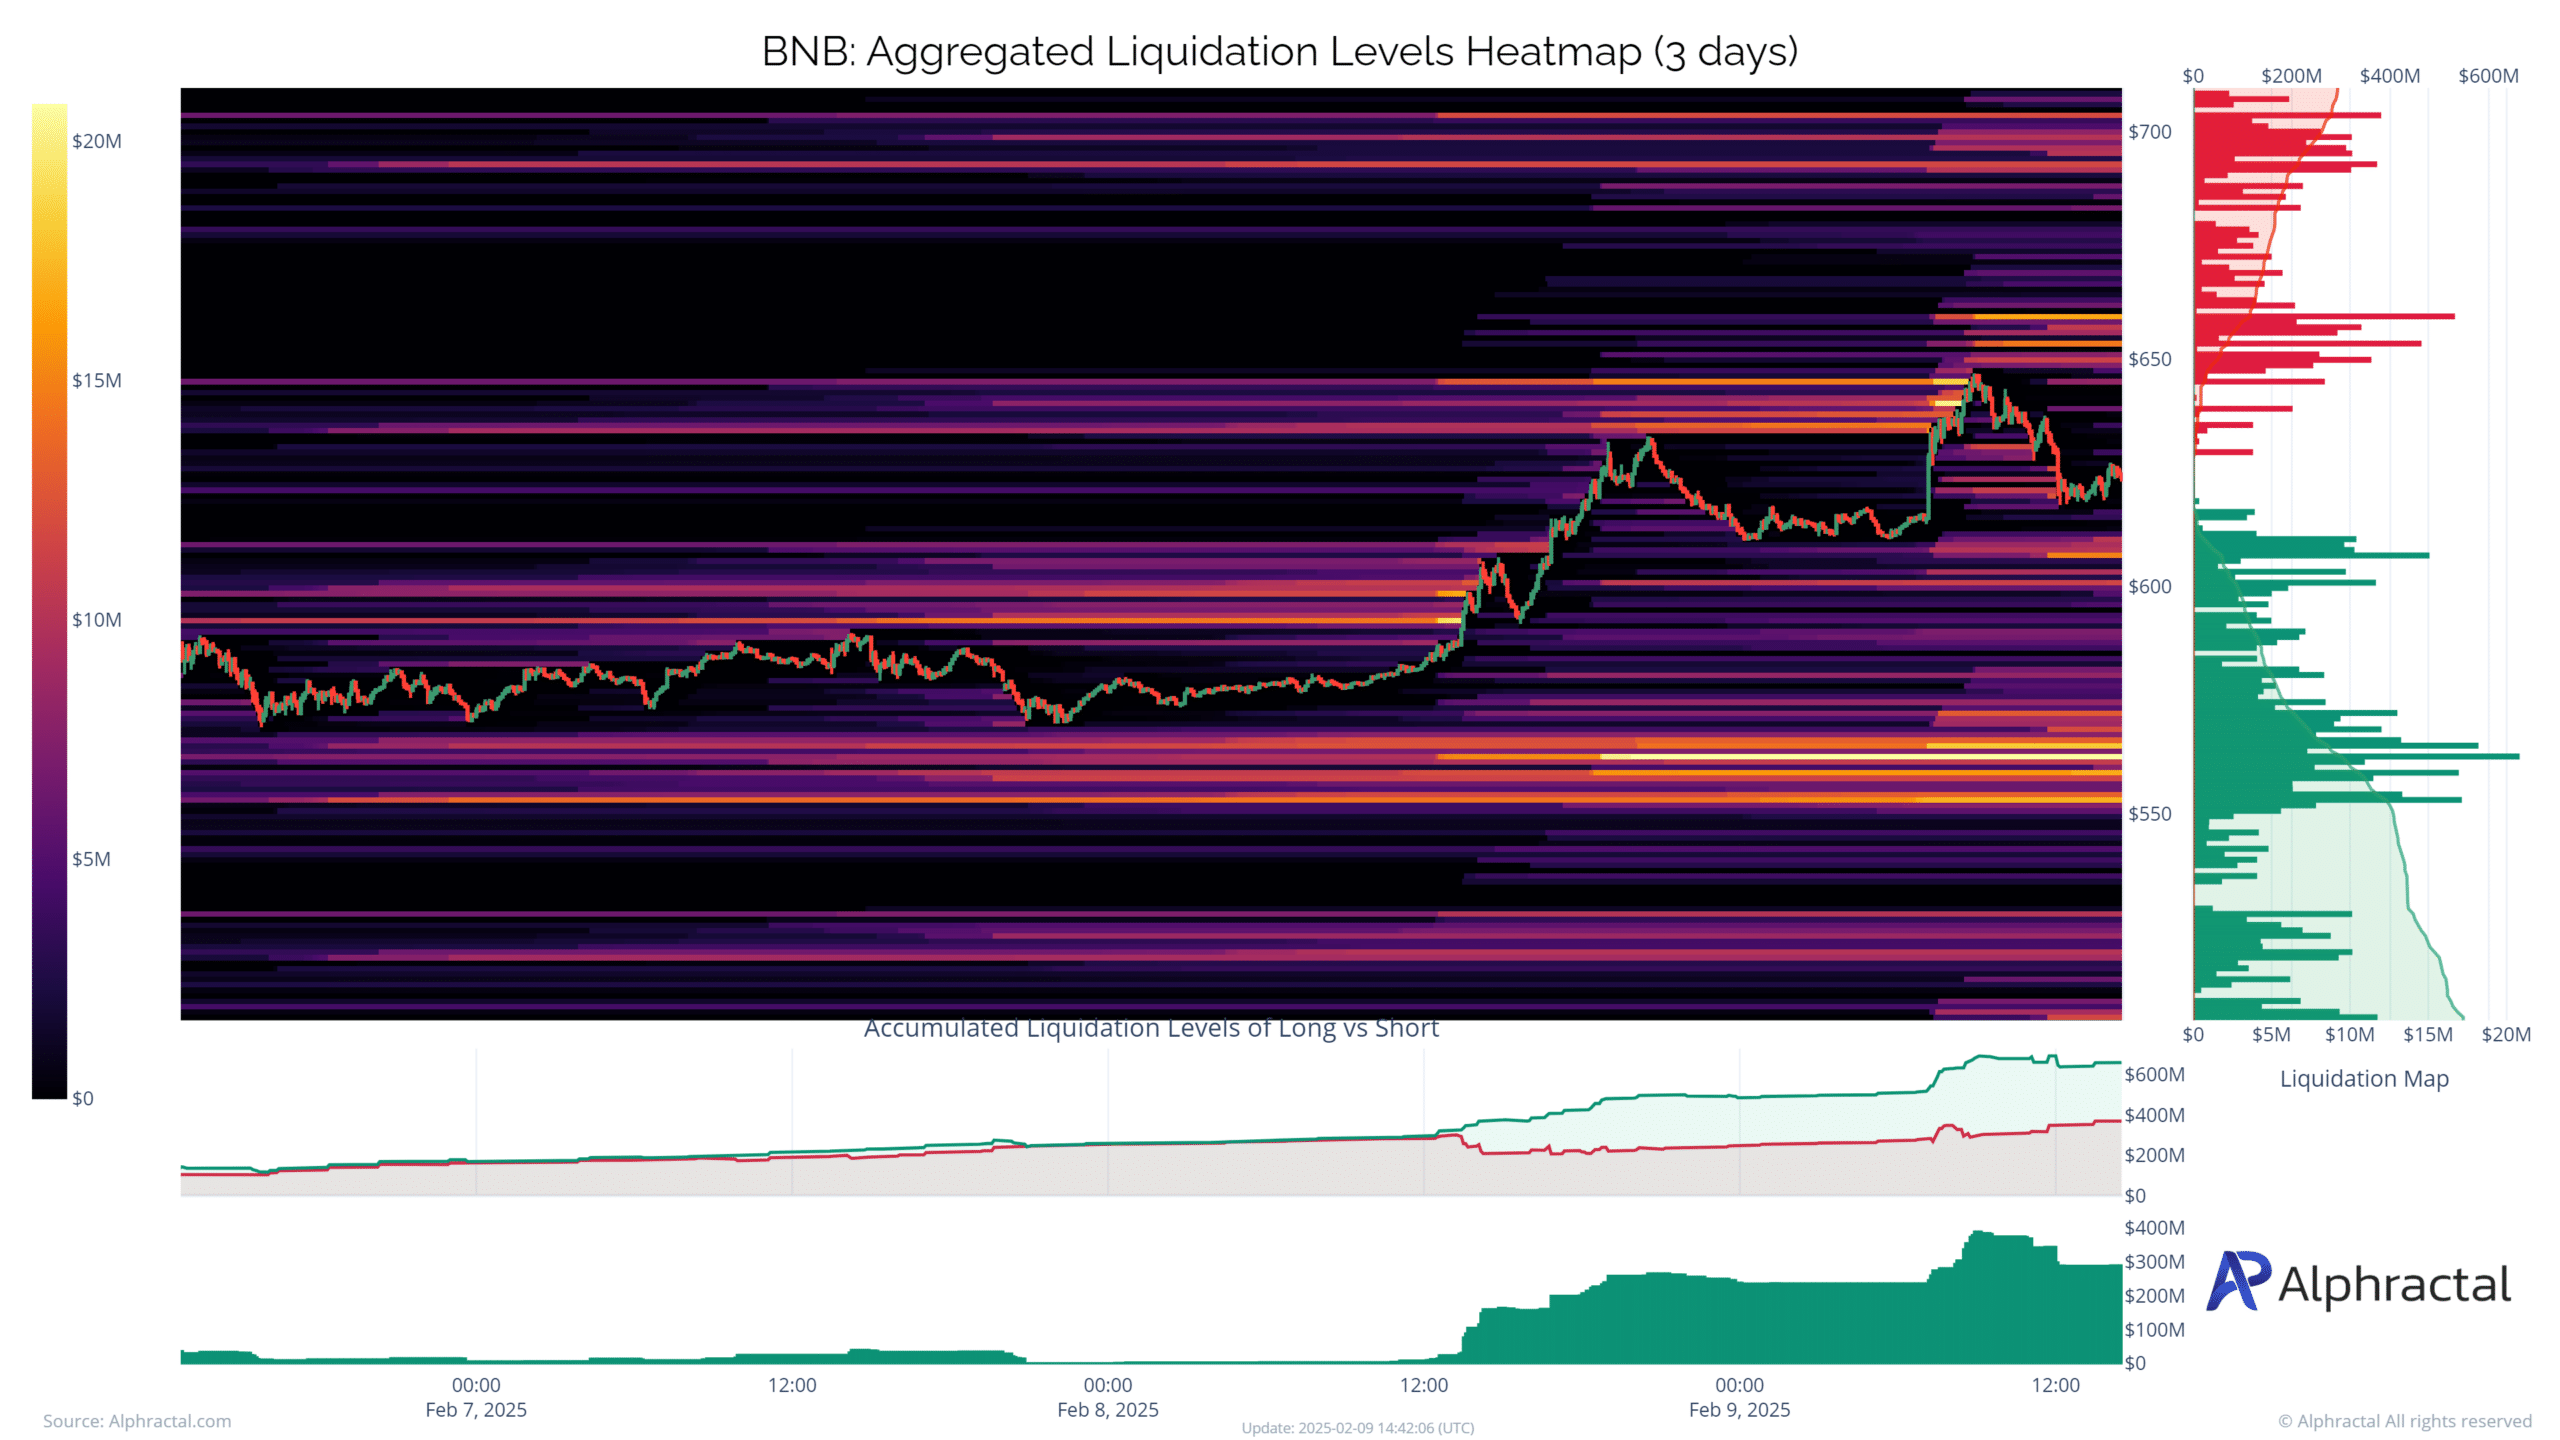
The BNB liquidation heatmap indicates active levels at $650 for long positions and $600 for shorts, creating a tight trading range. The concentration of liquidations above $650 signals strong resistance, while the dense short clusters near $600 imply support.
Despite the recent price stability, any decisive movement could trigger a series of liquidations, increasing volatility. A breakthrough above $650 could spur bullish momentum, while a drop below $600 might lead to rapid downward movement as shorts face liquidation.
With liquidity imbalances on both sides, BNB appears poised for a significant directional shift.
Read Bitcoin’s [BTC] Price Prediction 2025–2026
Cardano’s Key Support and Risk Zones: A Potential Squeeze Looming Ahead
Source: Alphractal
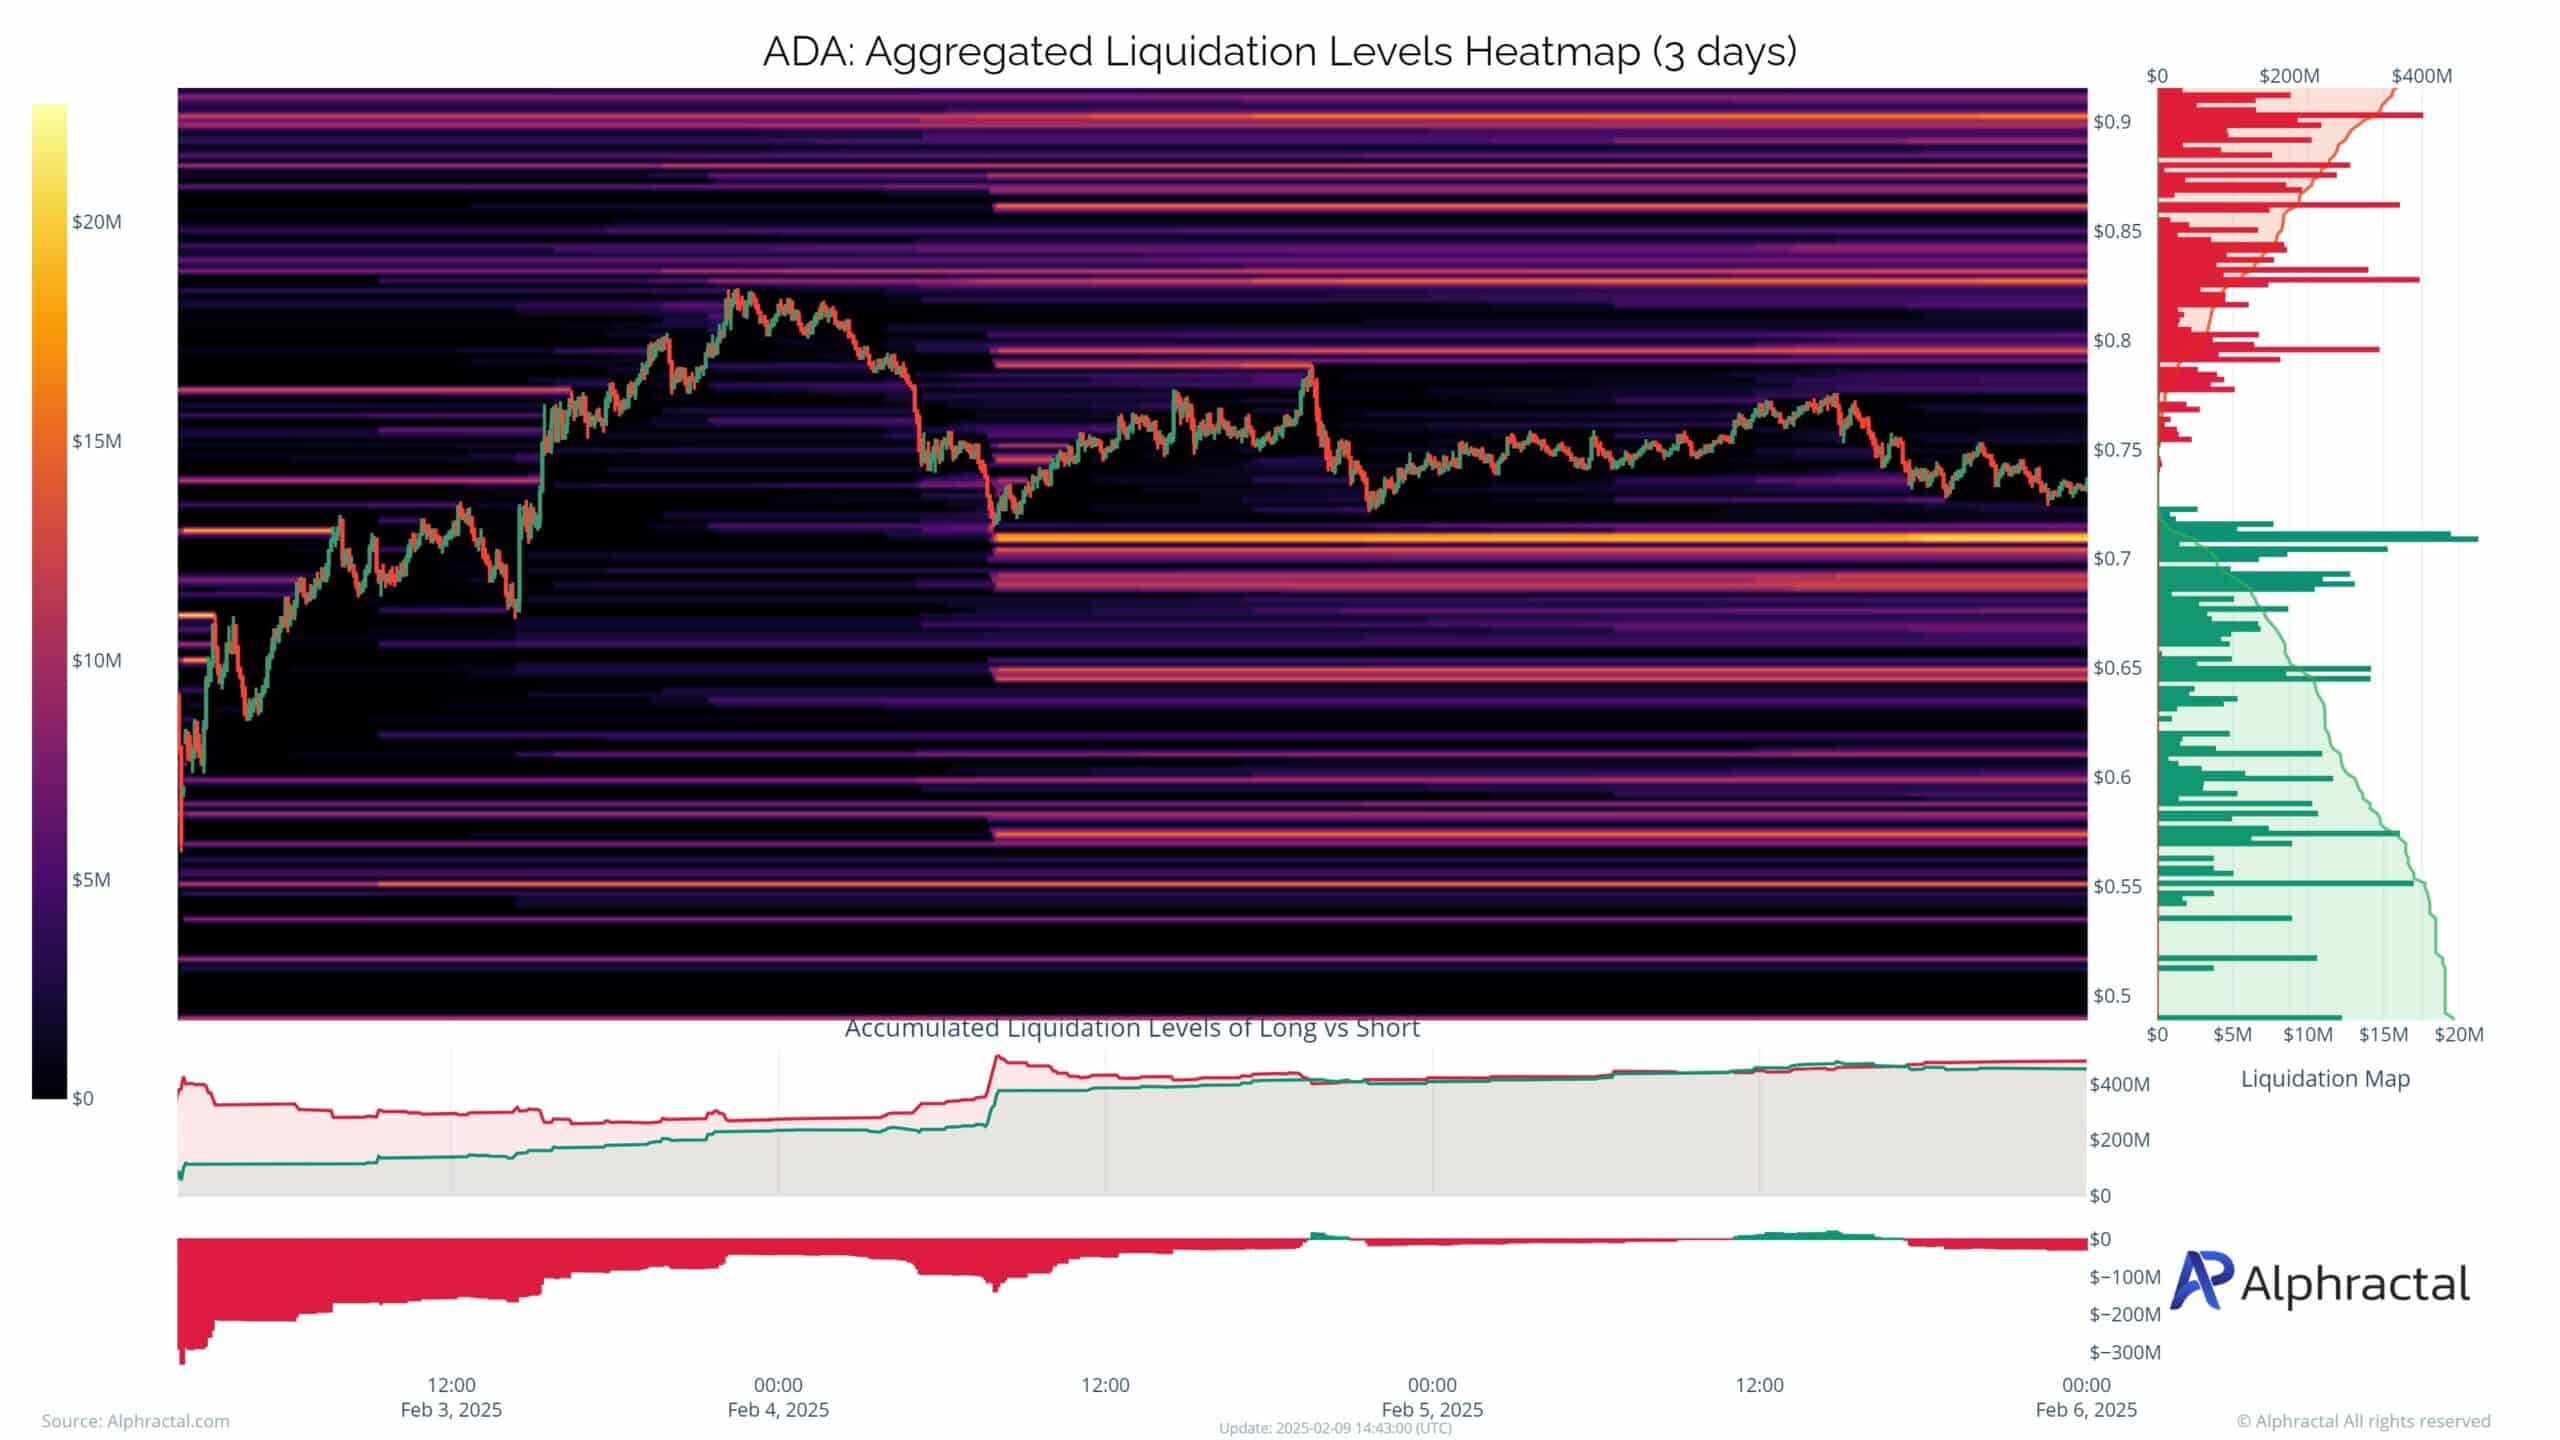
The ADA liquidation heatmap indicates strong support around $0.70, a level with significant long positions. While this offers a safety net against downward pressure, the high concentration of longs at this level poses a risk if the price continues to decline, potentially triggering a cascade of liquidations.
Resistance is building near $0.90, limiting immediate upward potential. In the event of sharp sell-offs, the $0.70-$0.65 range could become a squeeze zone, where forced liquidations may amplify the downward momentum. On the other hand, maintaining this level could reinforce bullish sentiment and pave the way for a rebound above $0.85.
text to make it more clear and concise:
Please rewrite the text to improve its clarity and conciseness.